Fig. 7.
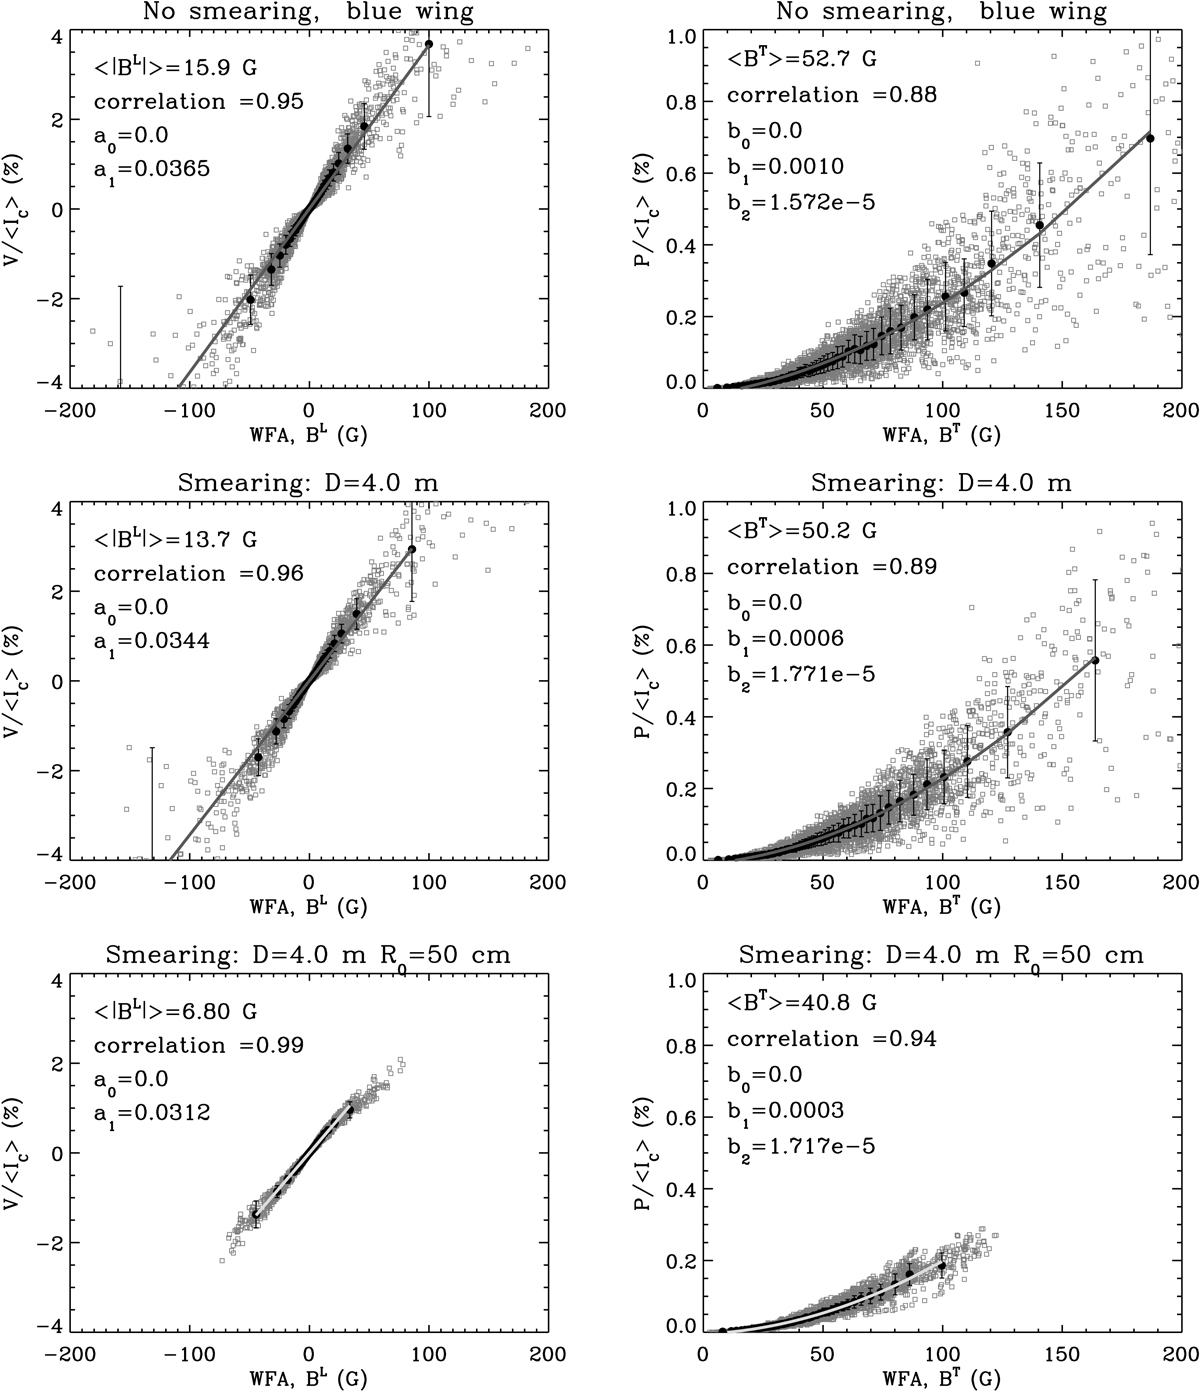
Left: scatter plots of the Stokes V signal (small gray squares) in the blue wing of the Si I 10 827 Å line against the longitudinal component BL of the magnetic field for three cases of spatial resolution. Right: same, but for the linear polarization P and the transverse component BT of the magnetic field. The BL and BT values have been inferred from synthetic Stokes profiles of the Si I line using the weak field approximation (WFA). Top: original spatial resolution (no smearing effects). Middle: finite spatial resolution due to the diffraction limit of a 4 m telescope. Bottom: reduced resolution caused by the telescope and seeing (R0 = 50 cm) effects. The V and P signals were calculated at the wavelength where the modulus of the intensity derivative is maximum. Black circles and vertical lines indicate, respectively, averages and error bars over bins with 50 surface points. The thick solid curves represent the first-degree (left panels) and the second-degree (right panels) polynomial fits to these averages. The mean values of the transverse and the unsigned longitudinal components, the correlation coefficients and the coefficients of the polynomial fits are shown in the respective panels. The scatter plots were calculated using the 3D snapshot model of Rempel (2014) discussed in Sect. 2.1.
Current usage metrics show cumulative count of Article Views (full-text article views including HTML views, PDF and ePub downloads, according to the available data) and Abstracts Views on Vision4Press platform.
Data correspond to usage on the plateform after 2015. The current usage metrics is available 48-96 hours after online publication and is updated daily on week days.
Initial download of the metrics may take a while.