Fig. 6.
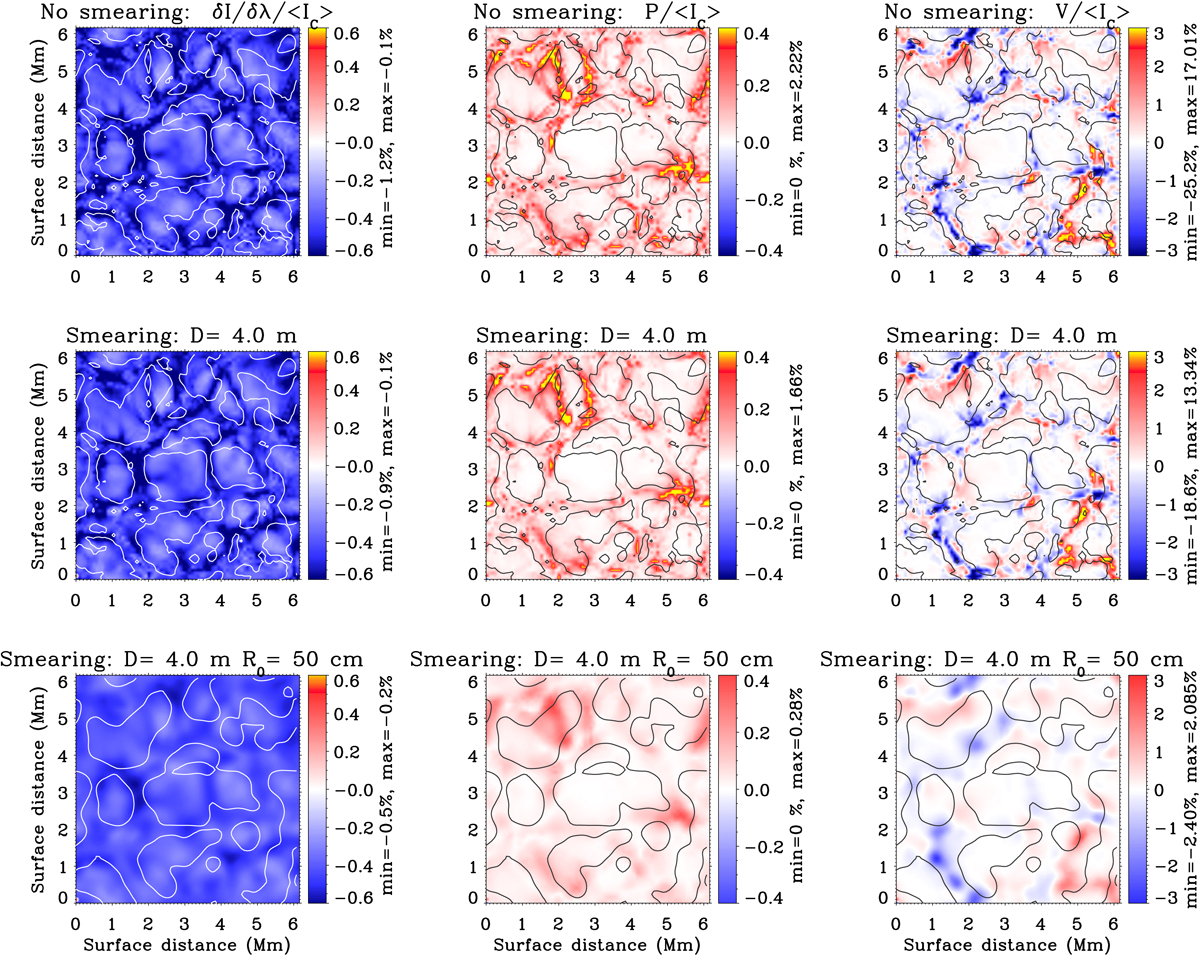
From left to right: maps of the intensity derivative ![]() , and of the P and V signals calculated with different spatial resolution in the blue wing of the Si I 10 827 Å line at wavelengths where the modulus of the intensity derivative is maximum. Top: original spatial resolution (no smearing effects). Middle: finite spatial resolution due to the light diffraction on a 4 m telescope. Bottom: surface variations of the Stokes signals affected by the finite spatial resolution of this telescope and seeing effects corresponding to the Fried parameter R0 = 50 cm. The lower and upper limits of the Stokes signals are indicated at the right side of the images. The solid curves mark the boundary of granules. The maps were calculated using the 3D model of Rempel (2014) discussed in Sect. 2.1.
, and of the P and V signals calculated with different spatial resolution in the blue wing of the Si I 10 827 Å line at wavelengths where the modulus of the intensity derivative is maximum. Top: original spatial resolution (no smearing effects). Middle: finite spatial resolution due to the light diffraction on a 4 m telescope. Bottom: surface variations of the Stokes signals affected by the finite spatial resolution of this telescope and seeing effects corresponding to the Fried parameter R0 = 50 cm. The lower and upper limits of the Stokes signals are indicated at the right side of the images. The solid curves mark the boundary of granules. The maps were calculated using the 3D model of Rempel (2014) discussed in Sect. 2.1.
Current usage metrics show cumulative count of Article Views (full-text article views including HTML views, PDF and ePub downloads, according to the available data) and Abstracts Views on Vision4Press platform.
Data correspond to usage on the plateform after 2015. The current usage metrics is available 48-96 hours after online publication and is updated daily on week days.
Initial download of the metrics may take a while.