Free Access
Fig. 5.
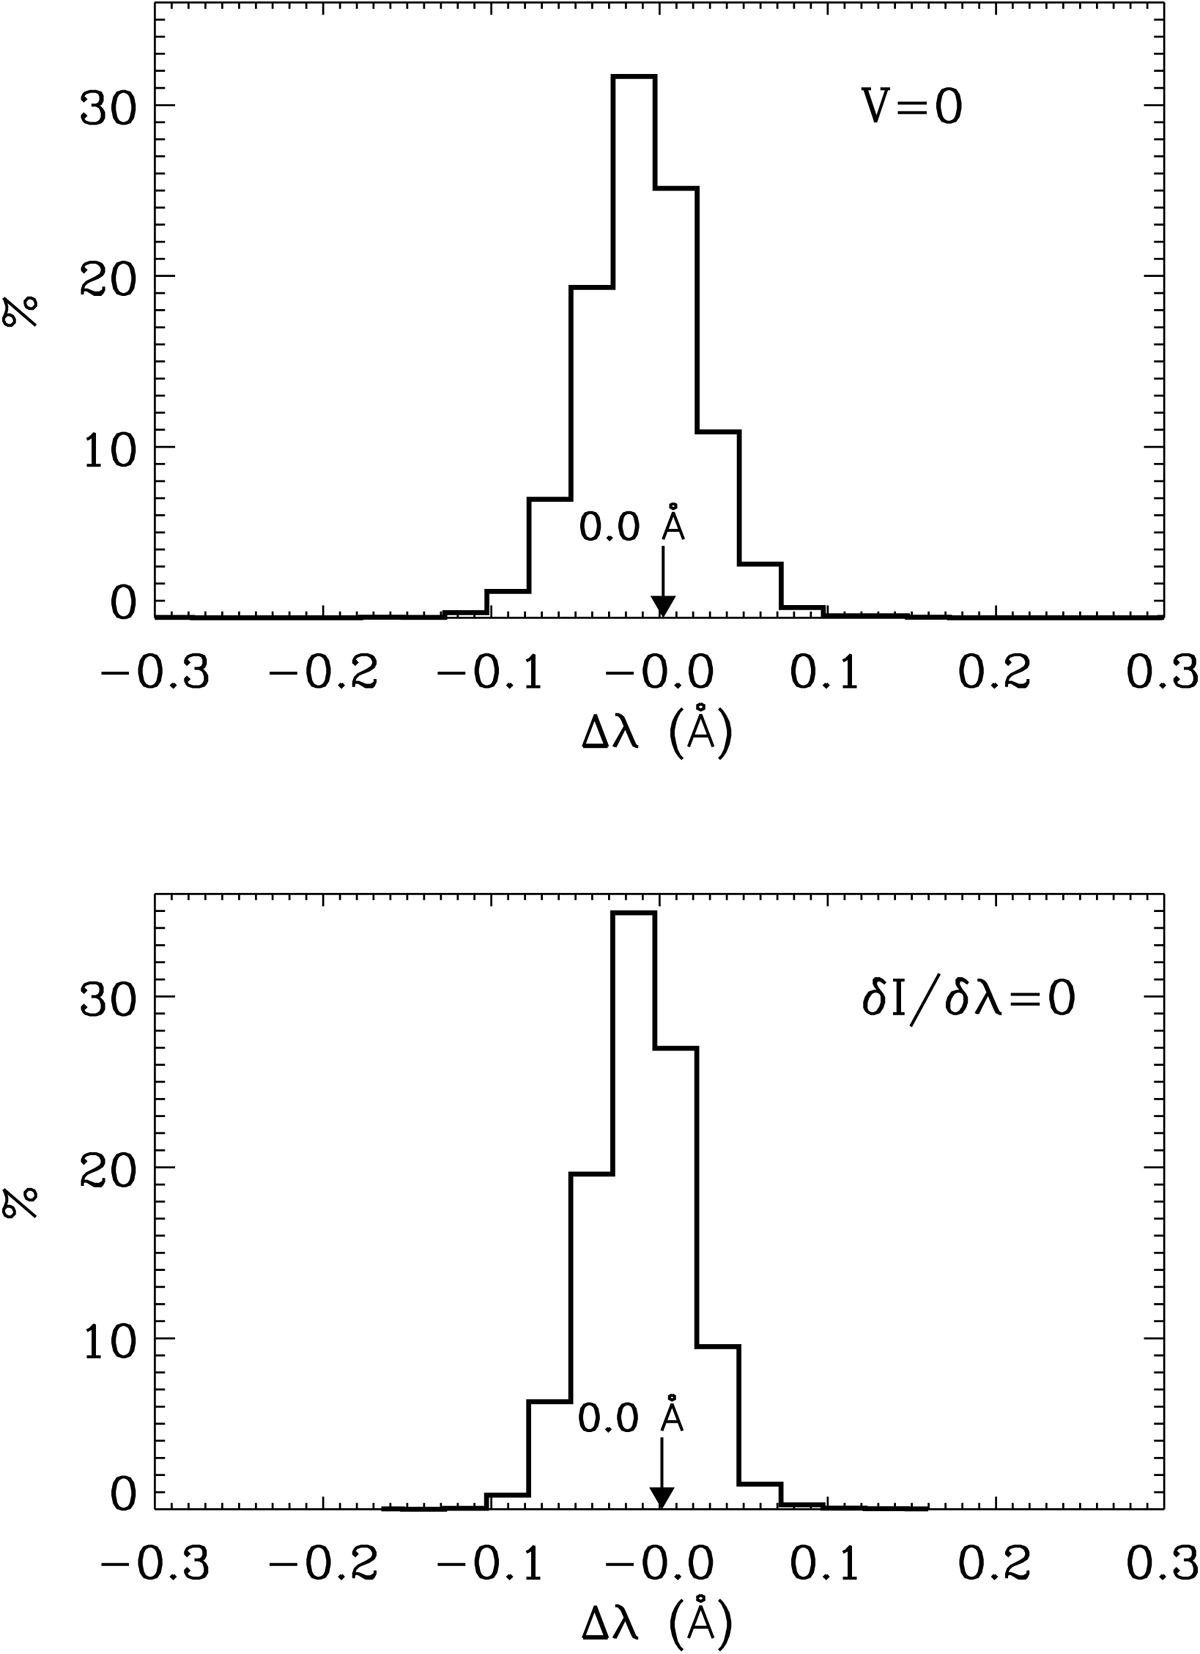
Top: histogram of the zero-crossing wavelength positions of the Stokes V profiles of the Si I 10 827 Å line formed in the 3D snapshot model. Bottom: same but for the intensity derivative. Arrows and numbers indicate the mean values of such zero-crossing positions.
Current usage metrics show cumulative count of Article Views (full-text article views including HTML views, PDF and ePub downloads, according to the available data) and Abstracts Views on Vision4Press platform.
Data correspond to usage on the plateform after 2015. The current usage metrics is available 48-96 hours after online publication and is updated daily on week days.
Initial download of the metrics may take a while.