Fig. 10.
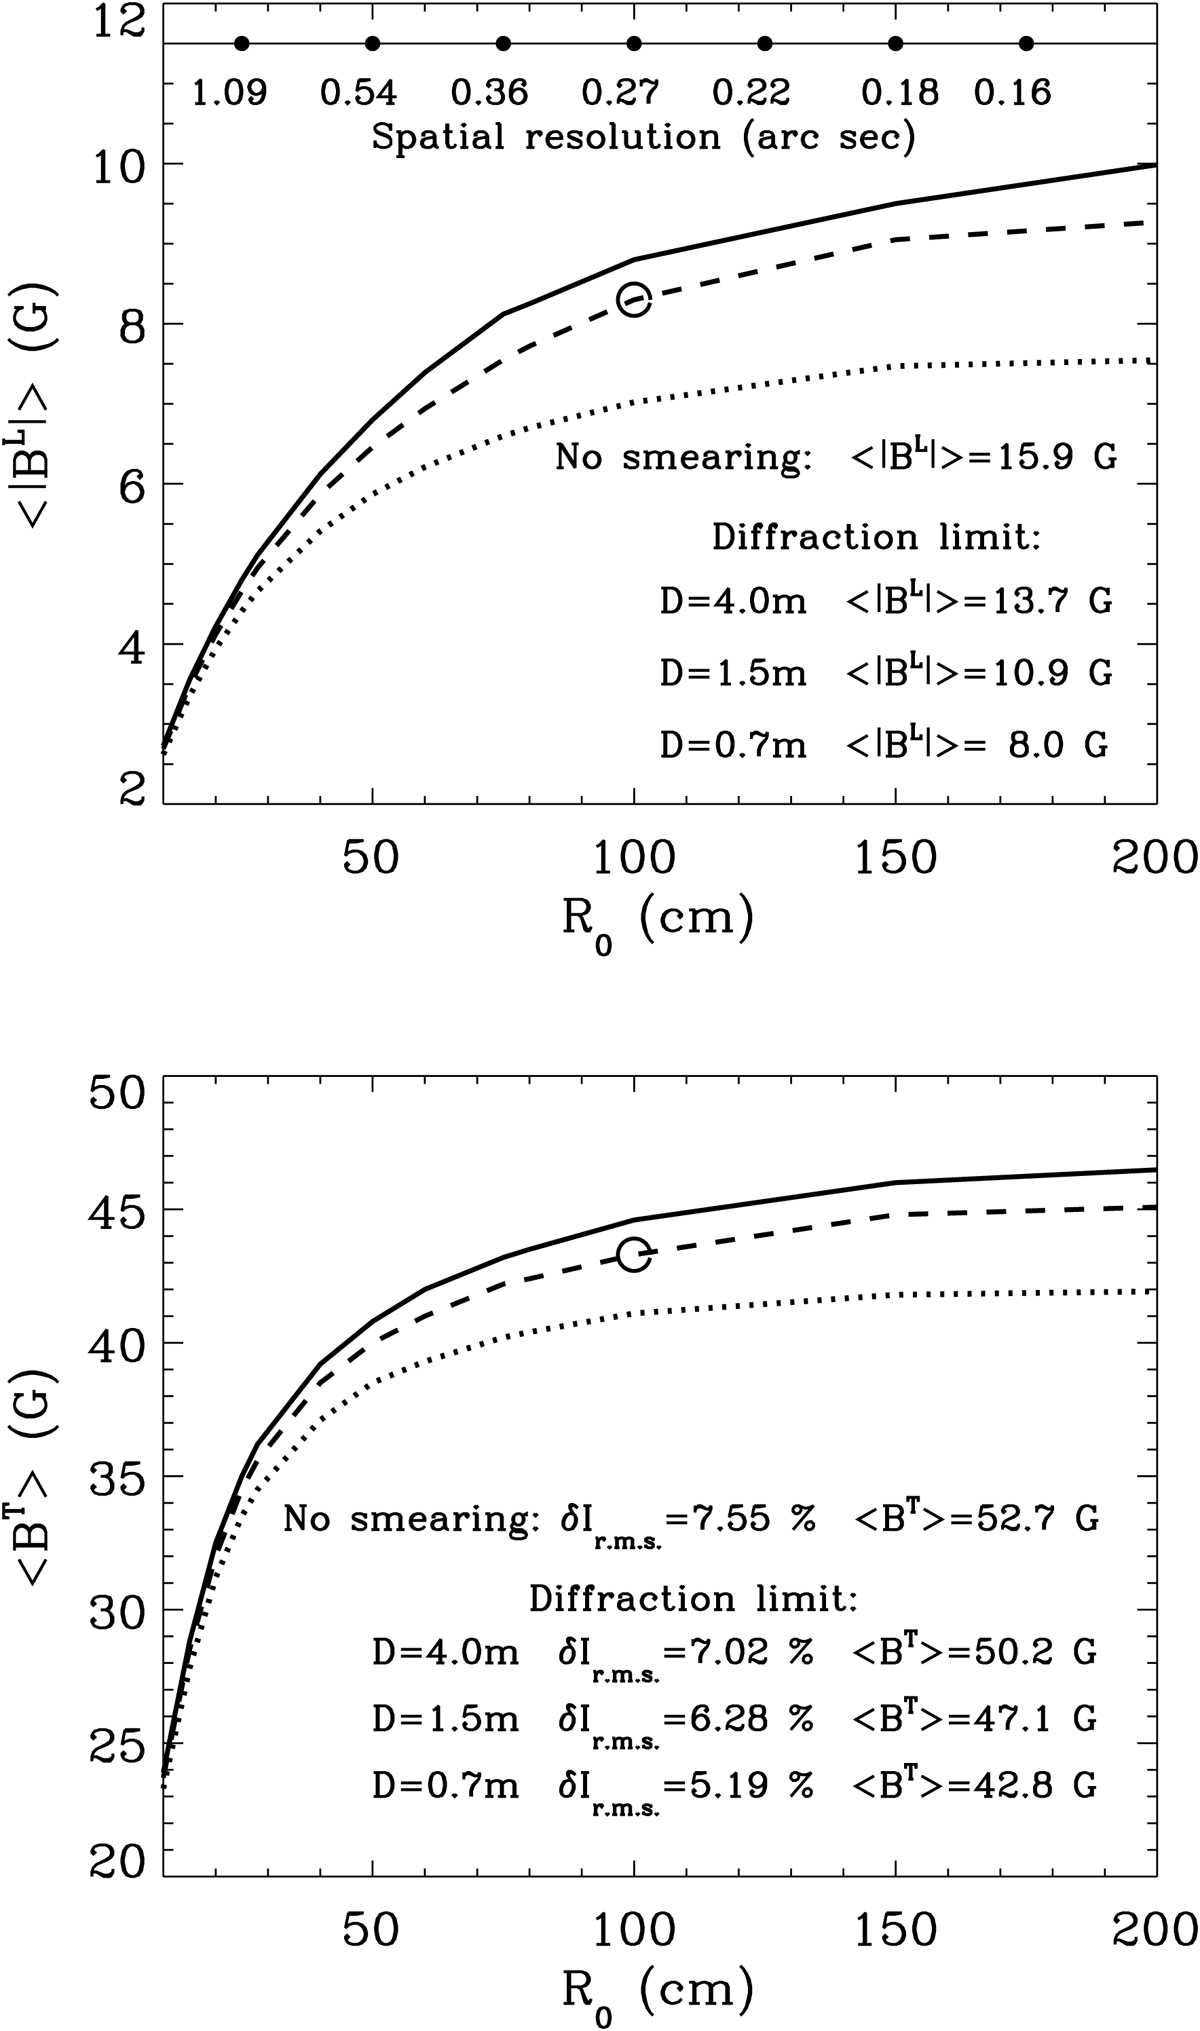
Top: mean unsigned longitudinal component ⟨|BL|⟩ of the magnetic field in the weak field limit as a function of the Fried parameter R0 at the wavelength λ = 10 827 Å. Bottom: same but for the mean transverse component ⟨BT⟩ of the magnetic field. Solid, dashed, and dotted curves correspond to telescope diameters 4 m, 1.5 m, and 0.7 m, respectively. Open circles indicate the ⟨|BL|⟩ and ⟨BT⟩ values for the best resolution that the GREGOR Infrared Spectrograph can achieve at 10 832 Å (Joshi et al. 2016). The rms continuum contrast δIrms, as well as the ⟨|BL|⟩ and ⟨BT⟩ values for the spatial resolution of the 3D model (no smearing and no noise effects) and for reduced resolutions due to the telescope diffraction are shown in the panels. We note that the mean vertical ⟨|BZ|⟩ and transverse ⟨|BXY|⟩ components of the model are equal to 25.7 G and =49.5 G, respectively. The top horizontal axis gives the spatial resolution, corresponding to the Fried parameter R0 shown in the bottom horizontal axis.
Current usage metrics show cumulative count of Article Views (full-text article views including HTML views, PDF and ePub downloads, according to the available data) and Abstracts Views on Vision4Press platform.
Data correspond to usage on the plateform after 2015. The current usage metrics is available 48-96 hours after online publication and is updated daily on week days.
Initial download of the metrics may take a while.