Fig. 1.
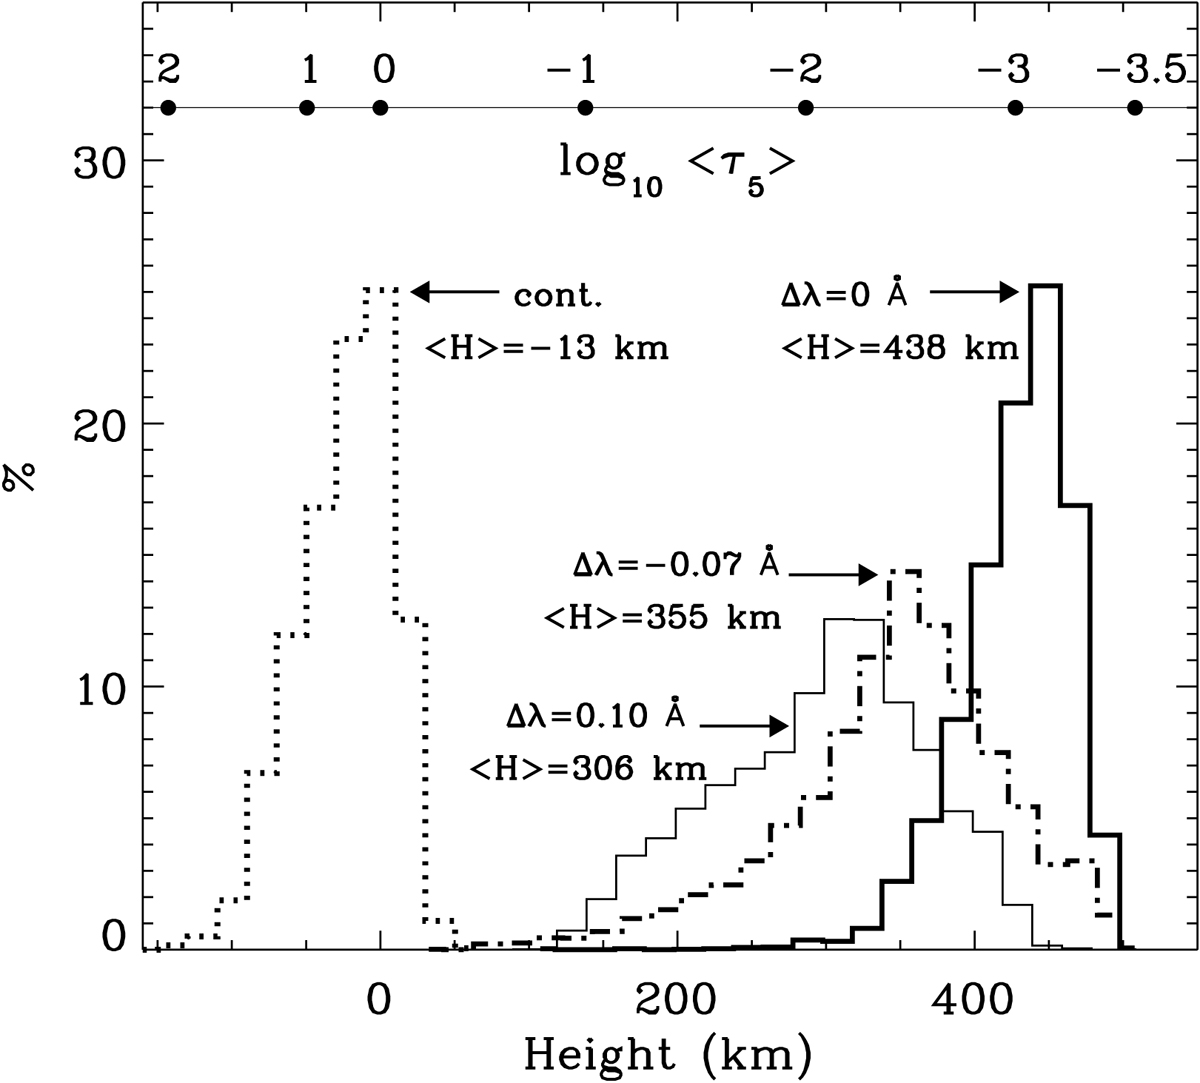
Histograms of the NLTE heights of formation calculated at four wavelengths within the Si I 10 827 Å line intensity profile. The top horizontal axis gives the mean optical depths ⟨τ5⟩ corresponding to the heights shown in the bottom horizontal axis. The mean heights of formation and wavelengths are shown close to each of the histograms. The histograms were calculated using the 3D snapshot model with ⟨|BZ|⟩ = 80 G (Rempel 2014) and the Si I model with six bound-bound transitions described by Shchukina et al. (2017).
Current usage metrics show cumulative count of Article Views (full-text article views including HTML views, PDF and ePub downloads, according to the available data) and Abstracts Views on Vision4Press platform.
Data correspond to usage on the plateform after 2015. The current usage metrics is available 48-96 hours after online publication and is updated daily on week days.
Initial download of the metrics may take a while.