Open Access
Fig. 9
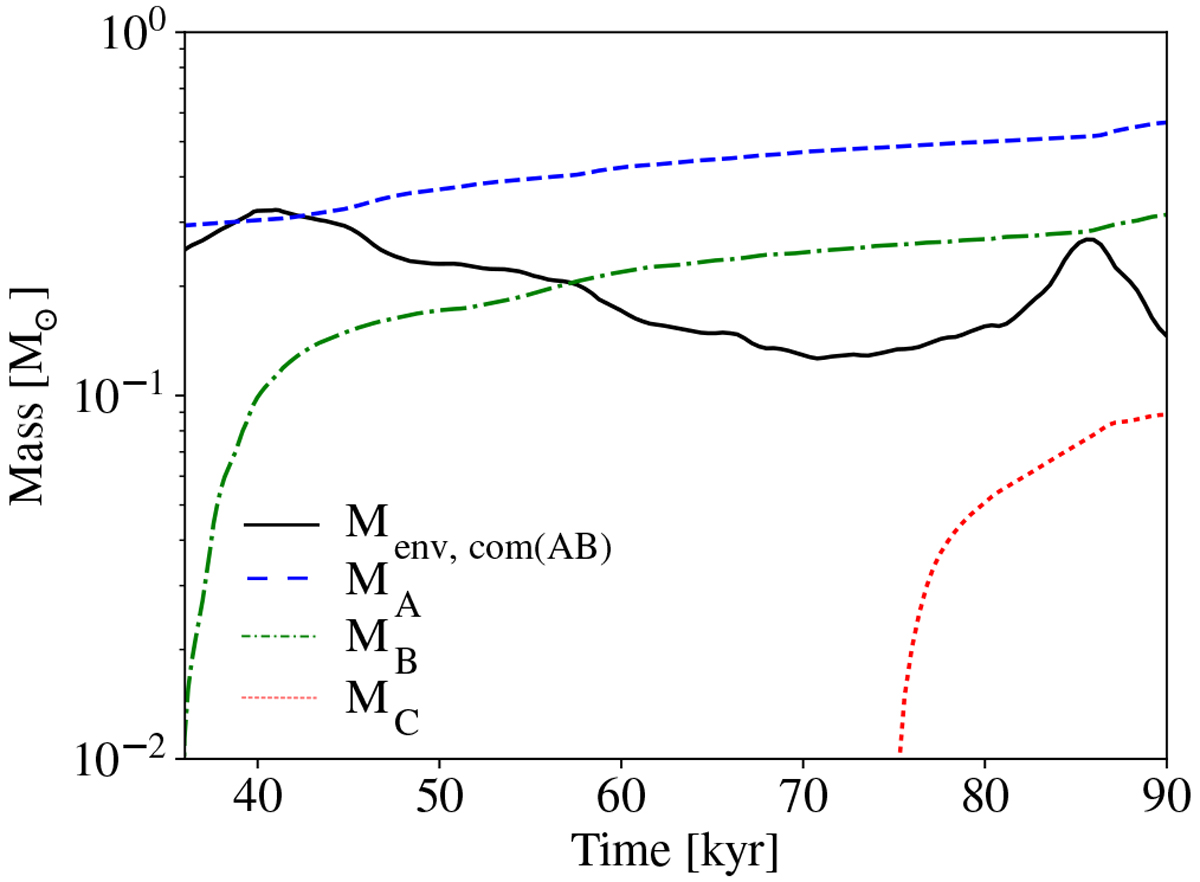
Evolution of mass located within distance of 1000 au from center of mass of primary and secondary (black solid line), mass of sink A (blue dashed line), mass of sink B (green dashed-dotted line), and mass of sink C (red dotted line).
Current usage metrics show cumulative count of Article Views (full-text article views including HTML views, PDF and ePub downloads, according to the available data) and Abstracts Views on Vision4Press platform.
Data correspond to usage on the plateform after 2015. The current usage metrics is available 48-96 hours after online publication and is updated daily on week days.
Initial download of the metrics may take a while.