Fig. 8
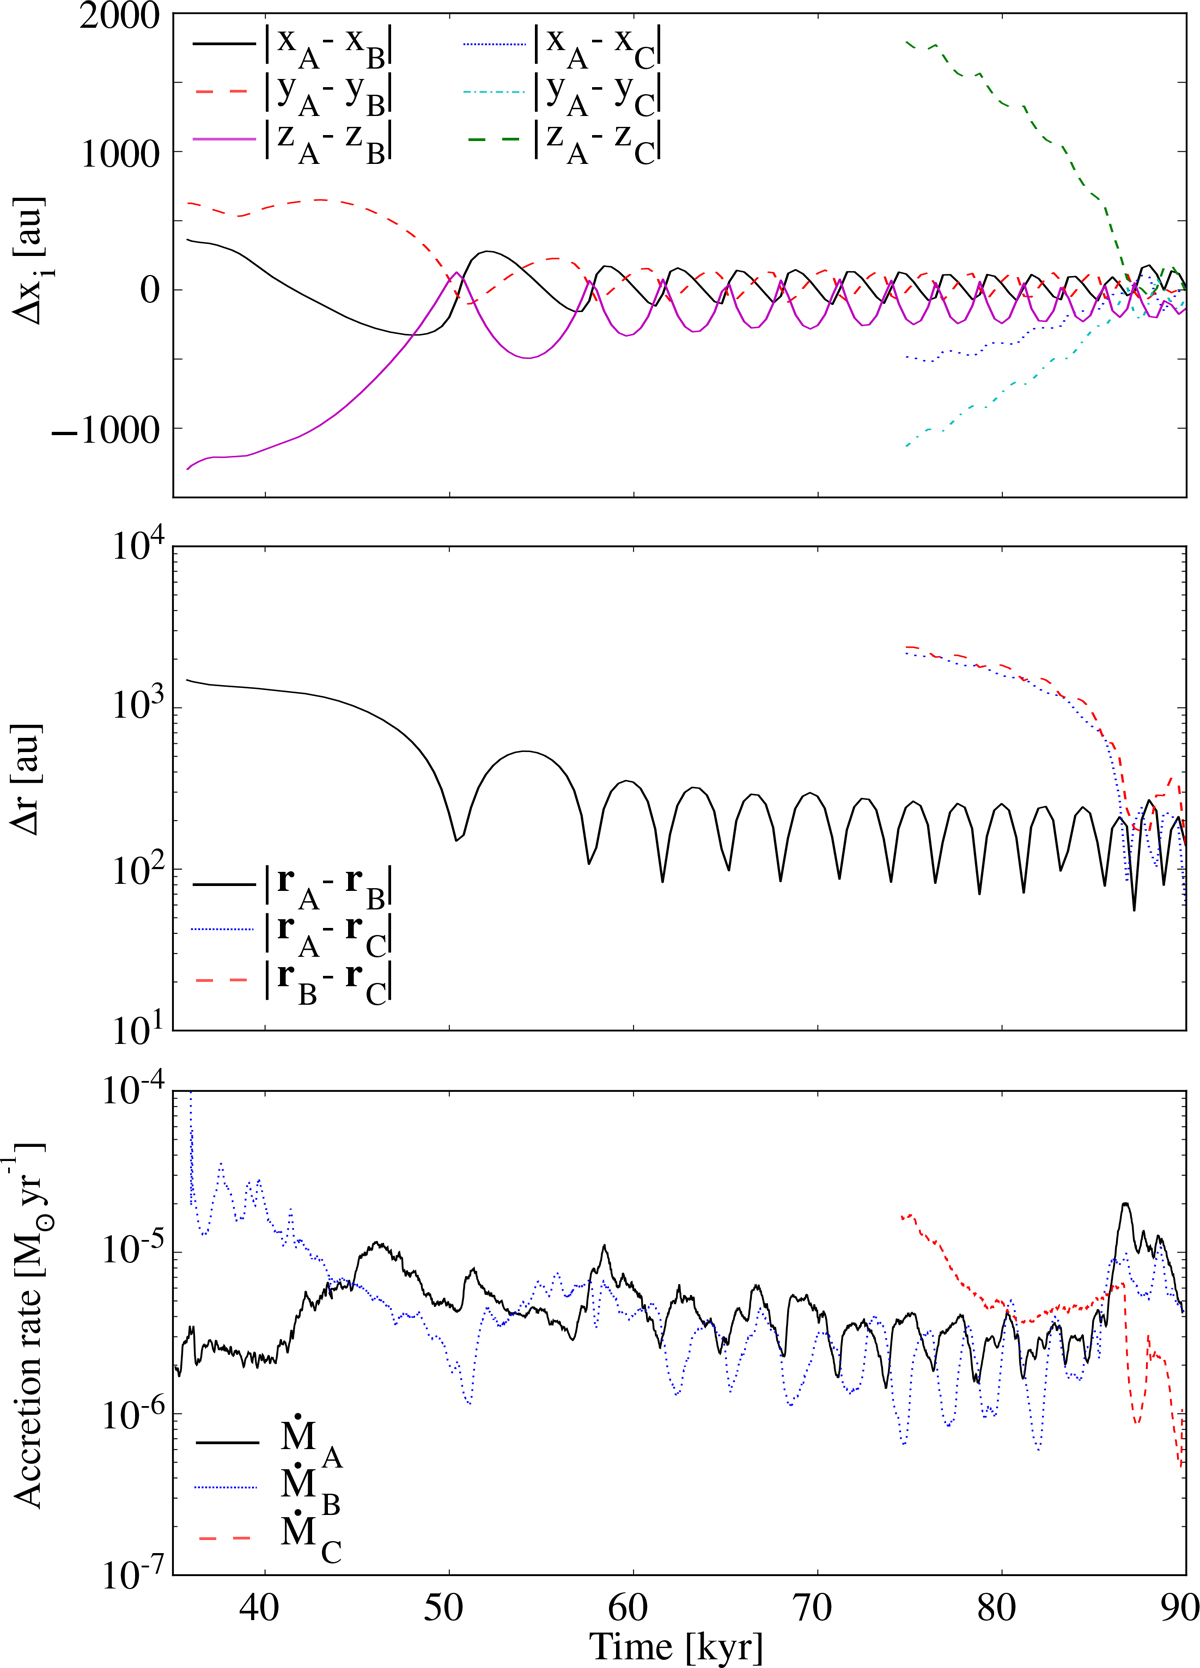
Evolution of distance between different objects of multiple stellar system. Upper panel: difference between sink A and B in x (black solid line), y (red dashed line), and z (magenta solid line), as well as the difference between sink A and C in x (blue dotted line), y (cyan dash-dotted line), and z (green dashed line). Middle panel: absolute distance r between sinks A and B (black solid line), sinks A and C (blue dotted line), and sinks B and C (red dashed line). Lower panel: accretion profile for the three sinks involved from t = 35 × 103 yr to t = 90 × 103 yr after formation of the primary. The black solid line represents the primary A, the blue dotted line corresponds to companion B, and the red dashed line corresponds to companion C.
Current usage metrics show cumulative count of Article Views (full-text article views including HTML views, PDF and ePub downloads, according to the available data) and Abstracts Views on Vision4Press platform.
Data correspond to usage on the plateform after 2015. The current usage metrics is available 48-96 hours after online publication and is updated daily on week days.
Initial download of the metrics may take a while.