Fig. 5
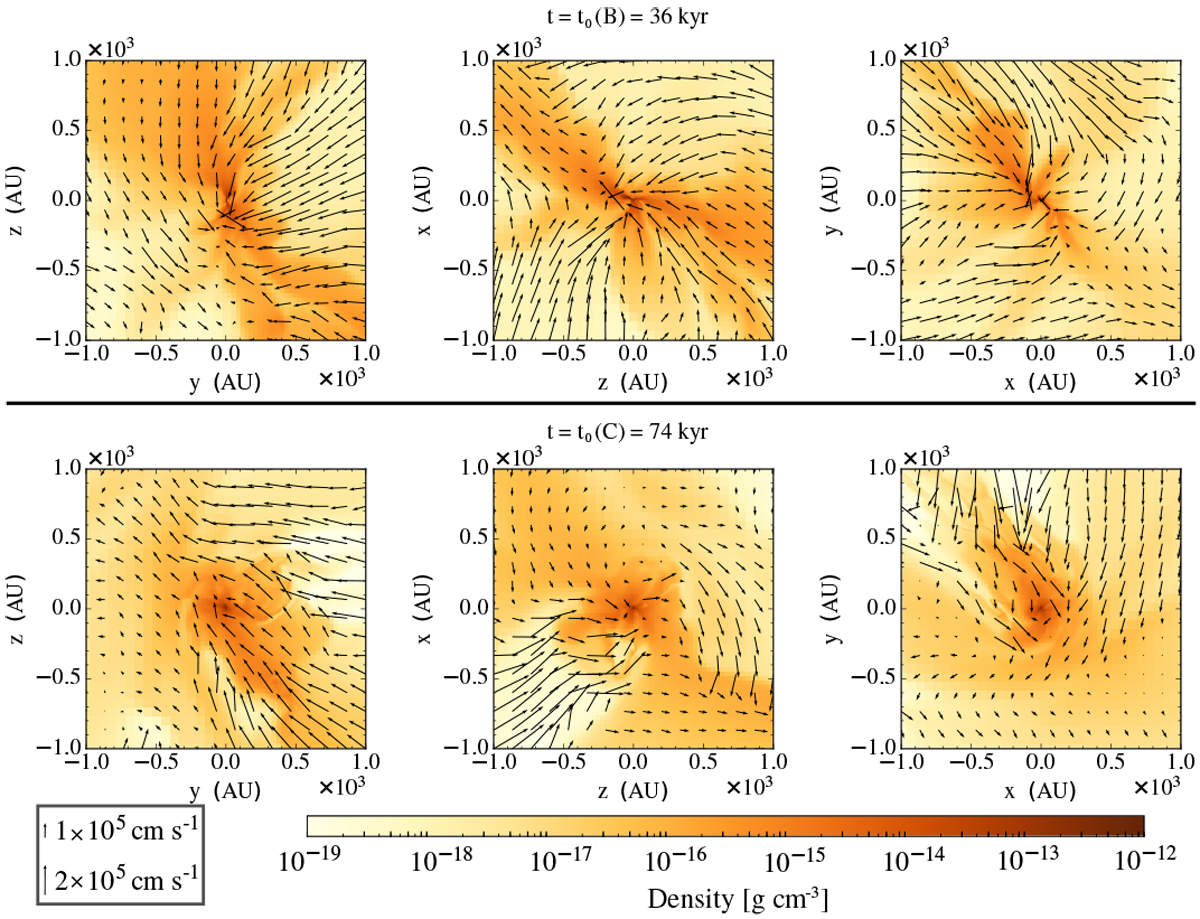
Density distribution at time t = tB,0 of formation of first companion B (upper panels) and formation of second companion C at t = tC,0 (lower panels). The panels show slices of the three planes spanned by the coordinate system (left: yz-plane, middle: zx-plane, and right: xy-plane) with the position of the forming sink at the center. The arrows show the velocity with respect to the systemic velocity in the corresponding plane for every 50th data point in the plane. The length of the arrows scales linearly with the velocity magnitude. In the lower left corner, the length corresponding to 105 and 2 × 105 cm s−1 is shown.
Current usage metrics show cumulative count of Article Views (full-text article views including HTML views, PDF and ePub downloads, according to the available data) and Abstracts Views on Vision4Press platform.
Data correspond to usage on the plateform after 2015. The current usage metrics is available 48-96 hours after online publication and is updated daily on week days.
Initial download of the metrics may take a while.