Fig. 5
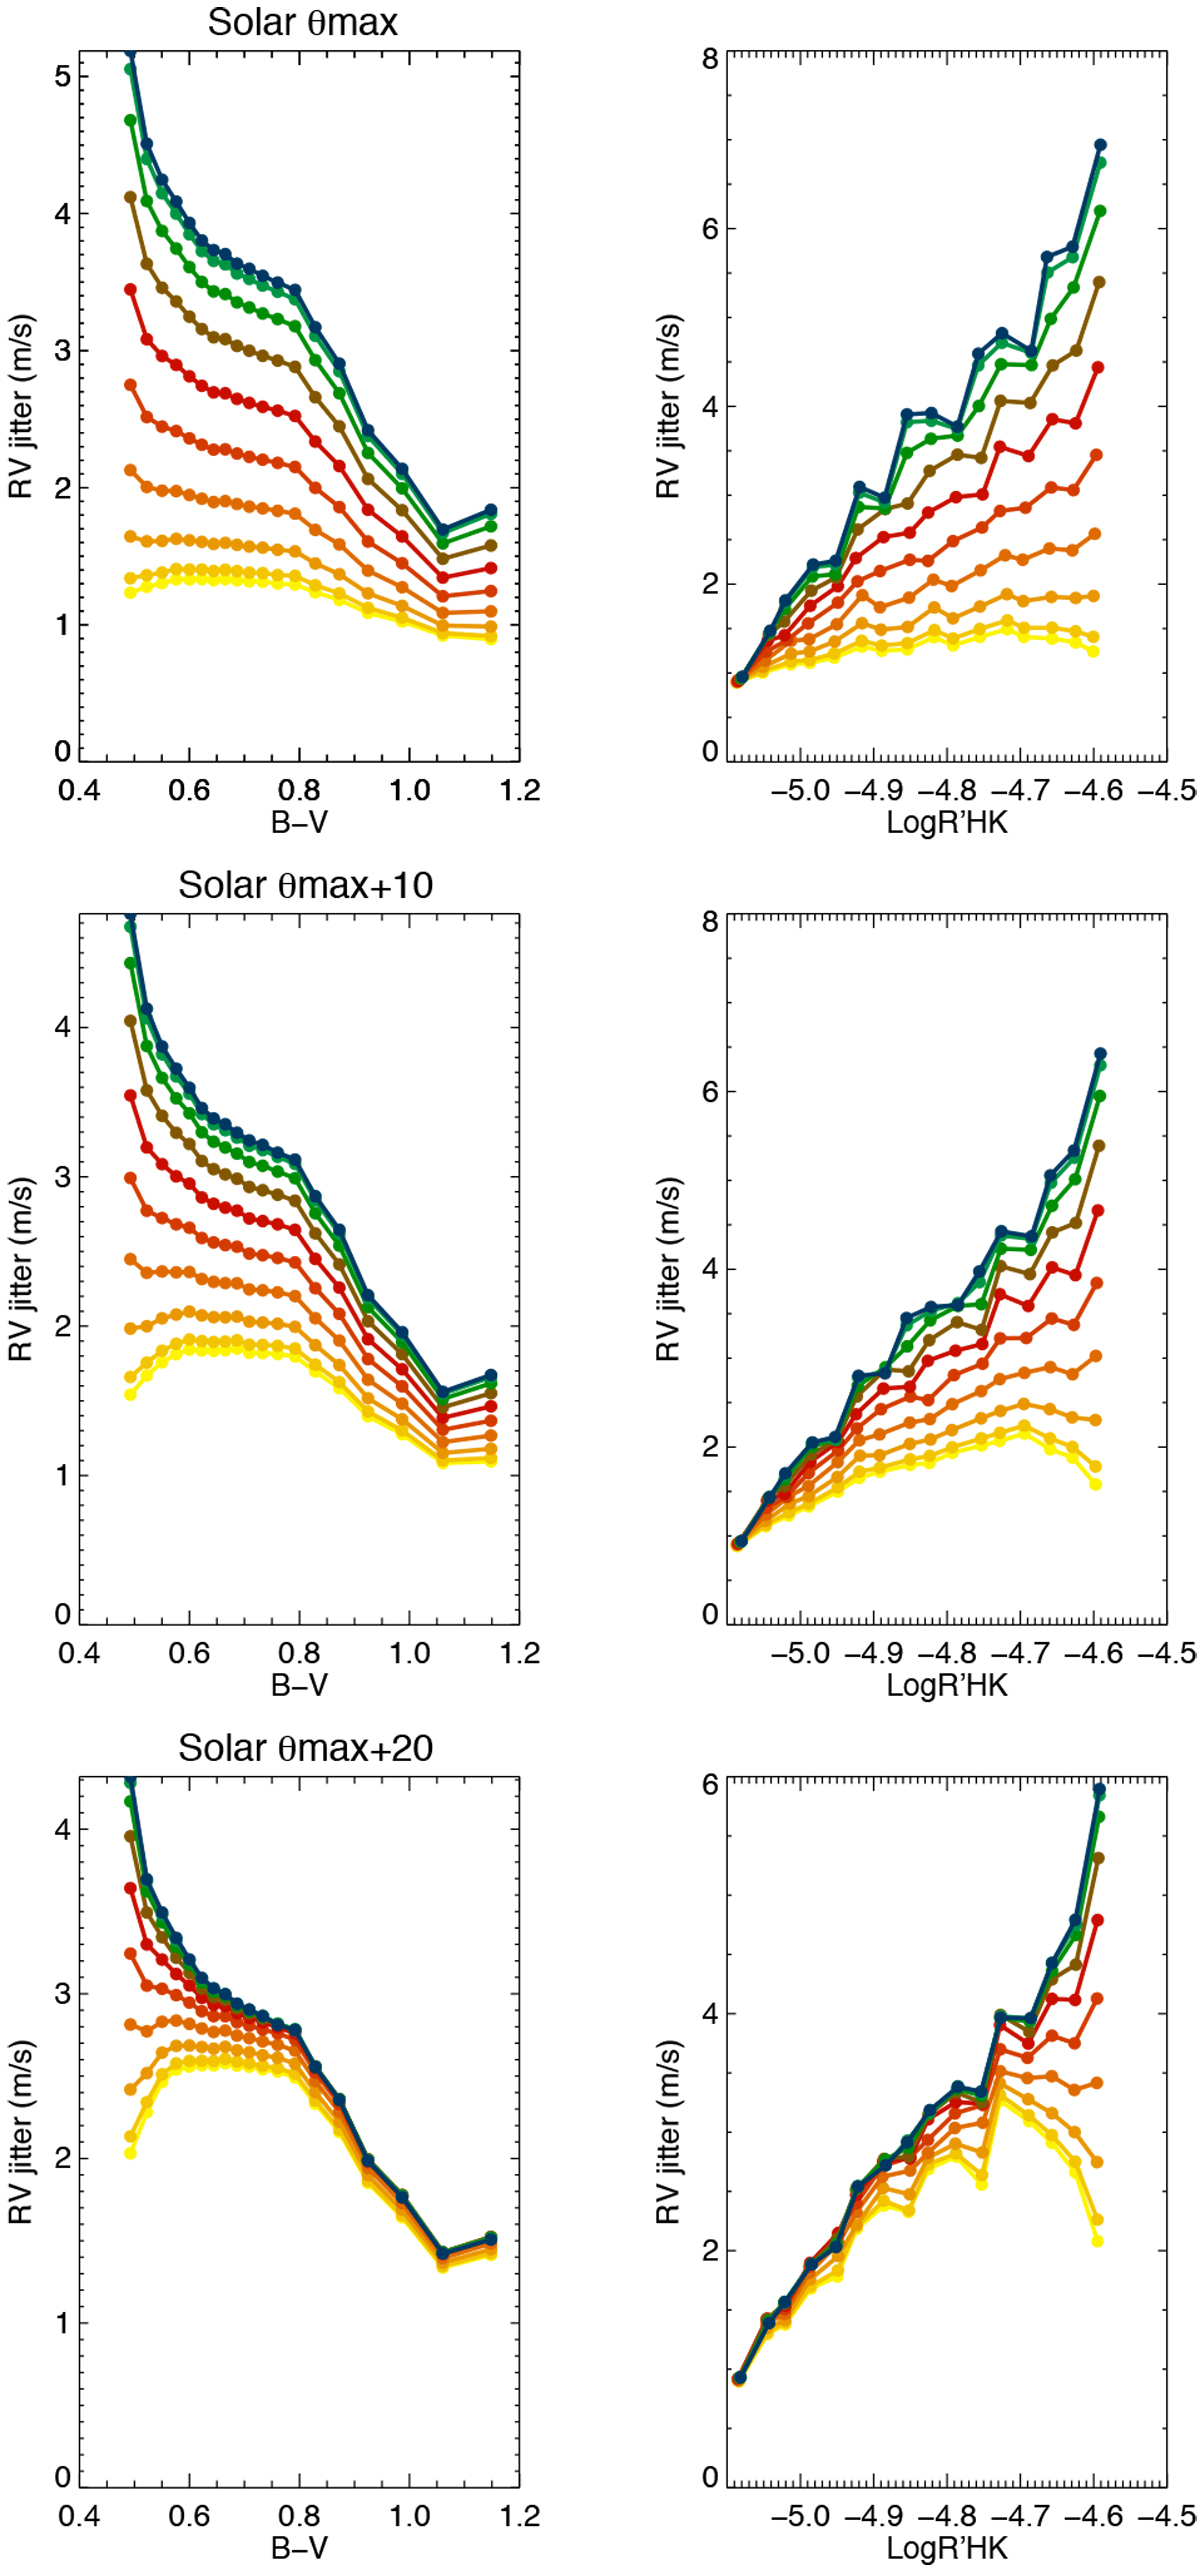
Upper panel: RV jitter (computed on rvact2 added to rvogs and rvinst) vs. B− V (right) and Log ![]() (left), for θmax equal to the solar value, and after binning in B−V and Log
(left), for θmax equal to the solar value, and after binning in B−V and Log ![]() , respectively. The color code is similar to Fig. 1. Middle panel: same for θmax equal to the solar value +10°. Lower panel:same for θmax equal to the solar value +20°.
, respectively. The color code is similar to Fig. 1. Middle panel: same for θmax equal to the solar value +10°. Lower panel:same for θmax equal to the solar value +20°.
Current usage metrics show cumulative count of Article Views (full-text article views including HTML views, PDF and ePub downloads, according to the available data) and Abstracts Views on Vision4Press platform.
Data correspond to usage on the plateform after 2015. The current usage metrics is available 48-96 hours after online publication and is updated daily on week days.
Initial download of the metrics may take a while.