Fig. 4
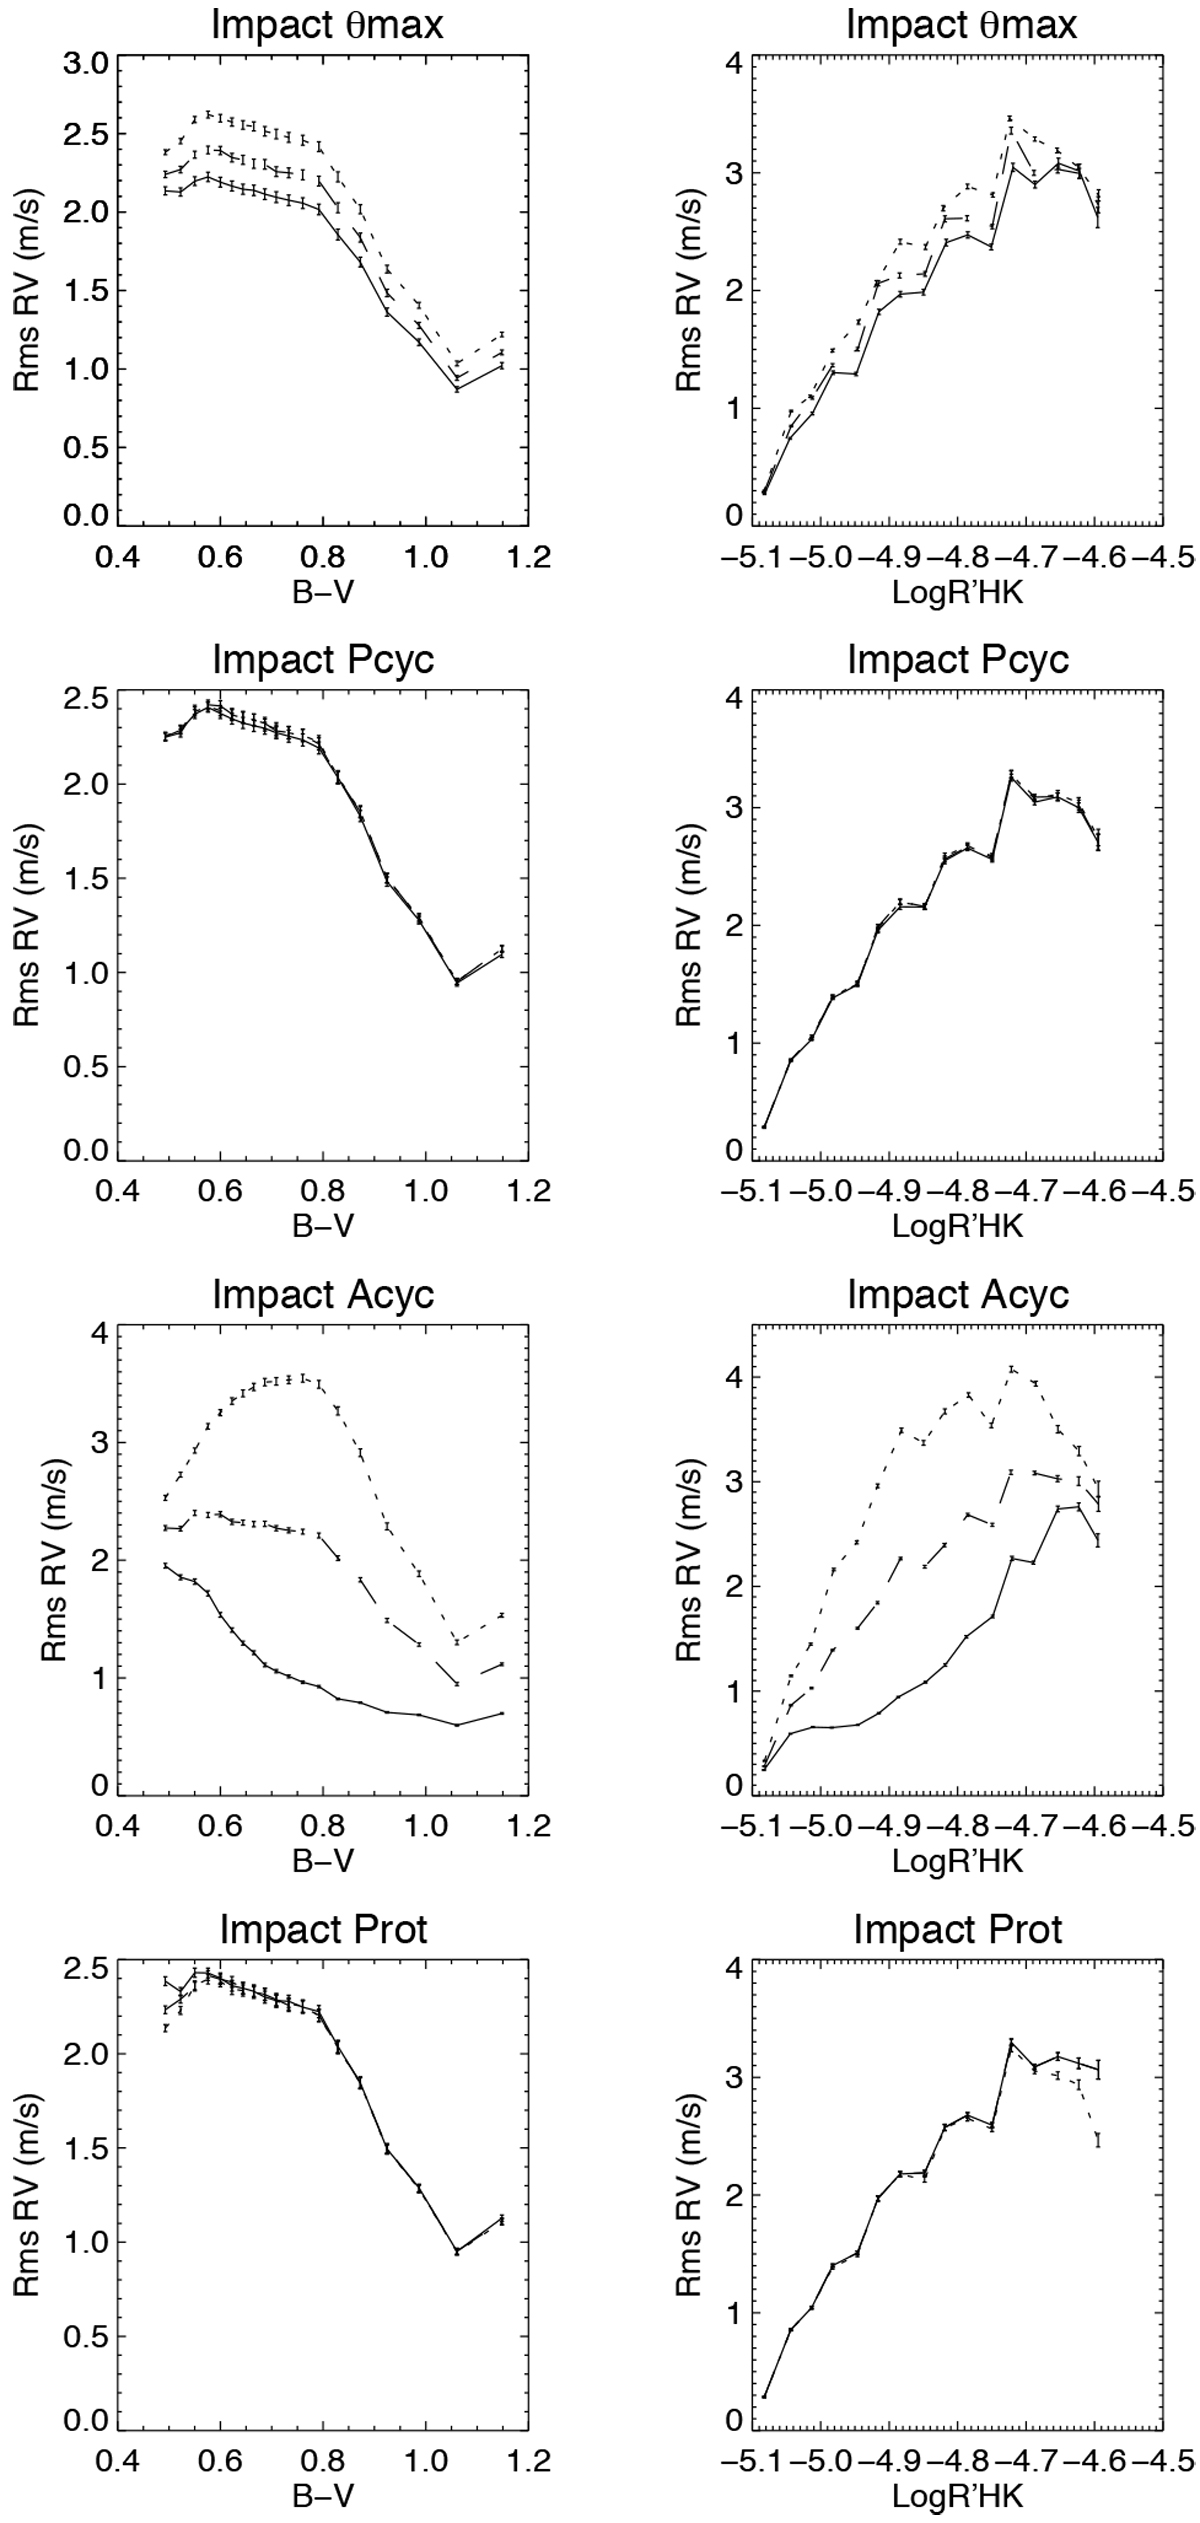
First line: average RV jitter (computed on rvact2 with no noise) in bins of B− V (left) and Log ![]() (right), for the three levels considered for θmax: lower value (solid), medium value (dashed line), and higher value (dotted line). Second line: same for the effect of Pcyc. Third line: same for the effect of Acyc. Fourth line: same for the effect of Prot.
(right), for the three levels considered for θmax: lower value (solid), medium value (dashed line), and higher value (dotted line). Second line: same for the effect of Pcyc. Third line: same for the effect of Acyc. Fourth line: same for the effect of Prot.
Current usage metrics show cumulative count of Article Views (full-text article views including HTML views, PDF and ePub downloads, according to the available data) and Abstracts Views on Vision4Press platform.
Data correspond to usage on the plateform after 2015. The current usage metrics is available 48-96 hours after online publication and is updated daily on week days.
Initial download of the metrics may take a while.