Open Access
Fig. 11
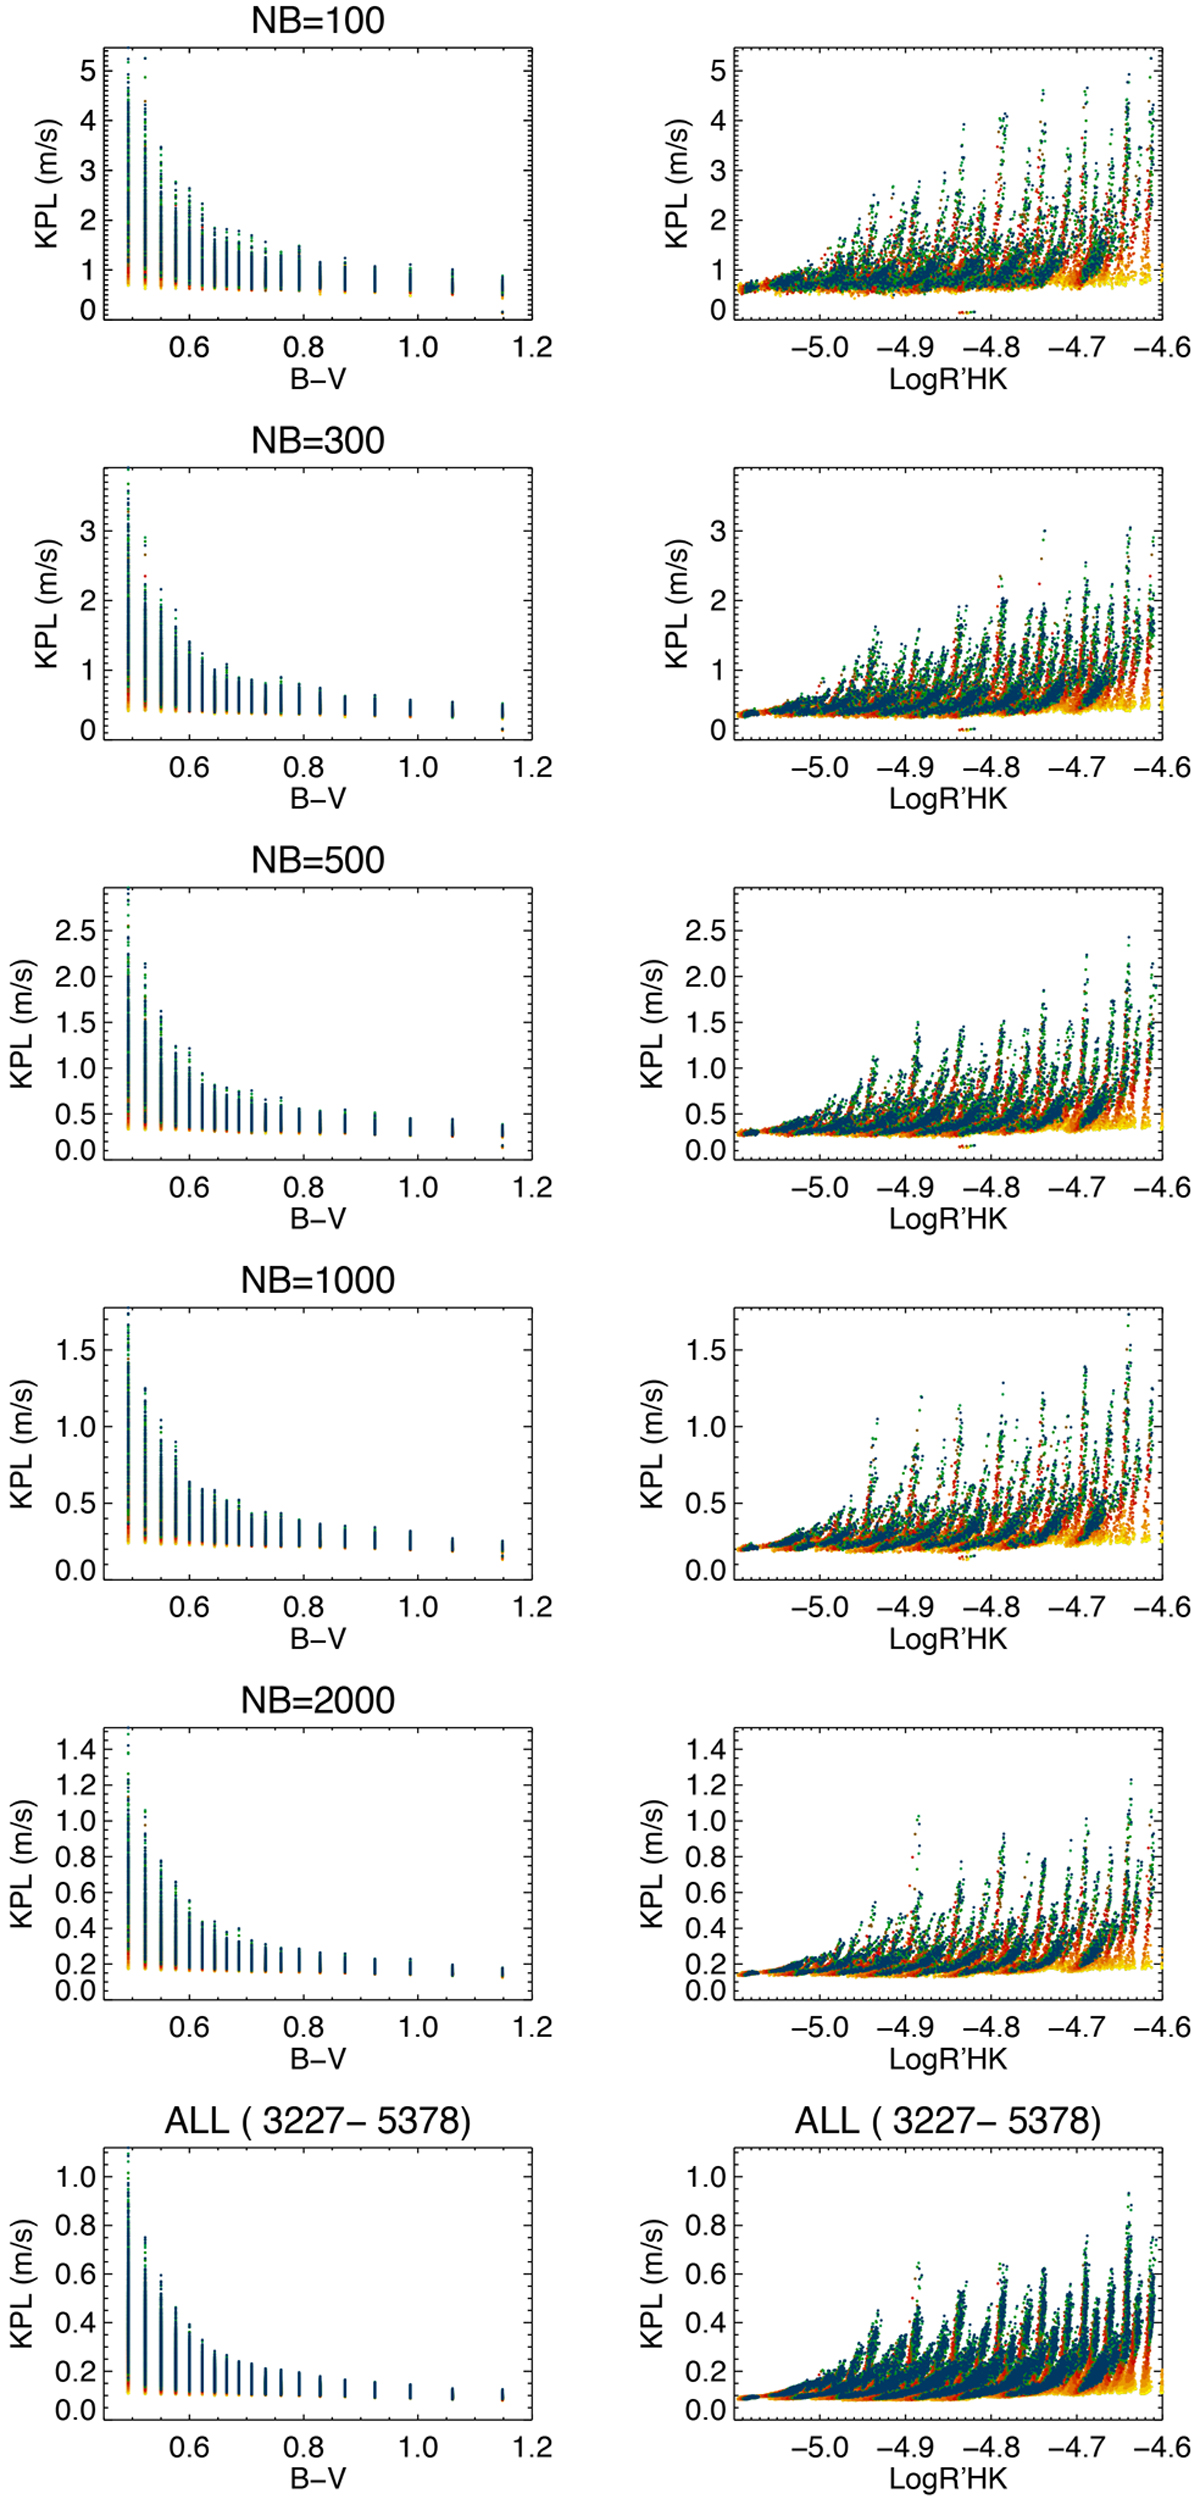
Kpl vs. B− V (left) and vs. Log ![]() (right) for different numbers of points, from top to bottom: 100, 300, 500, 1000, 2000 and all points in the original time series. Computations are made on time series including rvogs and rvinst for ΔTspot2 and C = 7.5. Same color code as Fig. 1.
(right) for different numbers of points, from top to bottom: 100, 300, 500, 1000, 2000 and all points in the original time series. Computations are made on time series including rvogs and rvinst for ΔTspot2 and C = 7.5. Same color code as Fig. 1.
Current usage metrics show cumulative count of Article Views (full-text article views including HTML views, PDF and ePub downloads, according to the available data) and Abstracts Views on Vision4Press platform.
Data correspond to usage on the plateform after 2015. The current usage metrics is available 48-96 hours after online publication and is updated daily on week days.
Initial download of the metrics may take a while.