Free Access
Fig. 4.
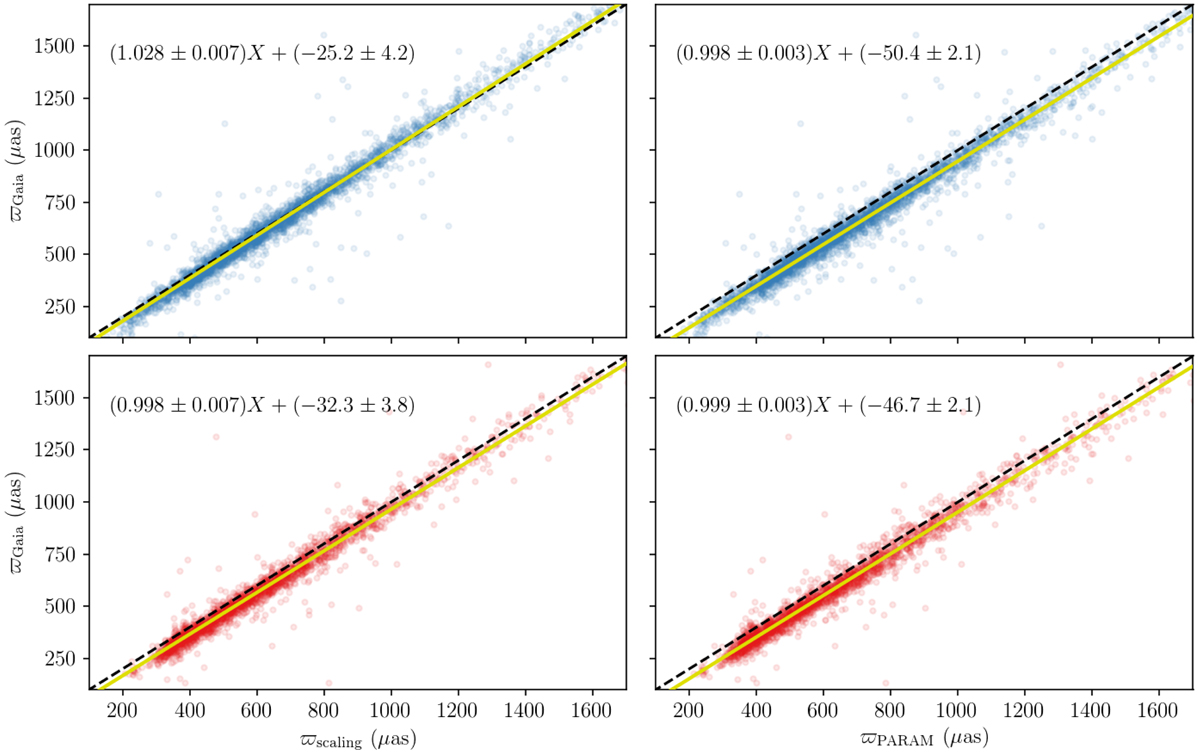
ϖGaia as a function of ϖscaling (left) and ϖPARAM (right), for RGB (top) and RC (bottom) stars. The yellow line indicates the linear fit, averaged over N realisations, for which the relation is given at the top of each subplot. The black dashed line indicates the 1:1 relation.
Current usage metrics show cumulative count of Article Views (full-text article views including HTML views, PDF and ePub downloads, according to the available data) and Abstracts Views on Vision4Press platform.
Data correspond to usage on the plateform after 2015. The current usage metrics is available 48-96 hours after online publication and is updated daily on week days.
Initial download of the metrics may take a while.