Fig. 2.
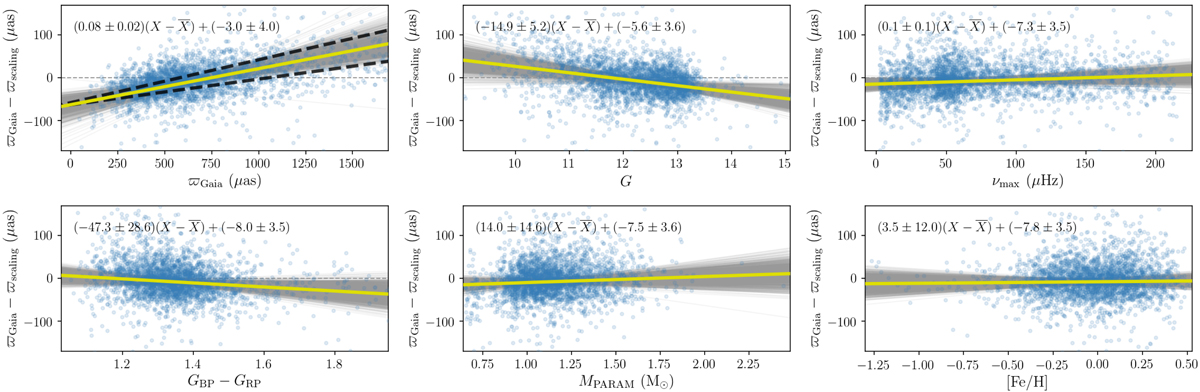
Parallax difference ϖGaia − ϖseismo for RGB stars, with the asteroseismic parallax derived from raw scaling relations, as a function of ϖGaia, G, νmax, GBP − GRP, MPARAM, and [Fe/H]. The distribution of the N realisations of the RANSAC algorithm is indicated by the grey-shaded region and the yellow line displays the average linear fit, for which the relation is given at the top of each subplot. The values of ![]() for RGB stars are given in Table 1. The summary statistics are:
for RGB stars are given in Table 1. The summary statistics are: ![]() as,
as, ![]() as, and z = 0.89. The black dashed lines correspond to the average linear fits when a ±100 K shift in Teff is applied.
as, and z = 0.89. The black dashed lines correspond to the average linear fits when a ±100 K shift in Teff is applied.
Current usage metrics show cumulative count of Article Views (full-text article views including HTML views, PDF and ePub downloads, according to the available data) and Abstracts Views on Vision4Press platform.
Data correspond to usage on the plateform after 2015. The current usage metrics is available 48-96 hours after online publication and is updated daily on week days.
Initial download of the metrics may take a while.