Fig. 15.
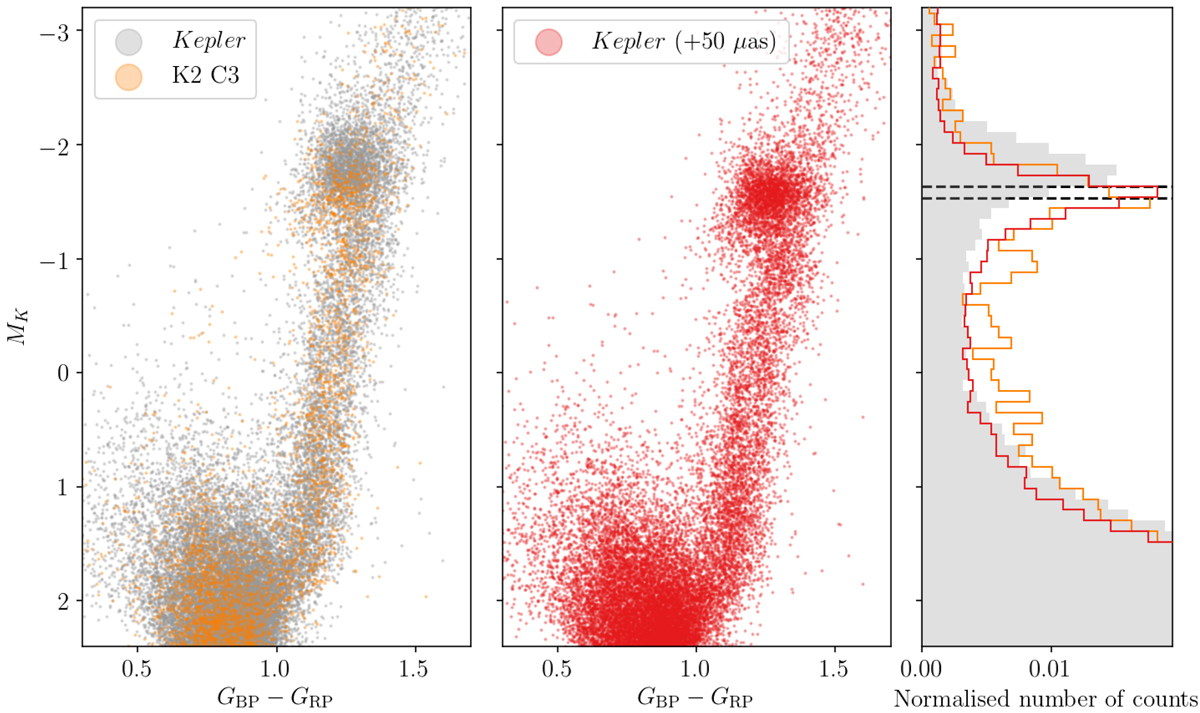
Colour-magnitude diagrams (CMDs; left and middle) and absolute magnitude MK normalised histograms (right), where MK is estimated by means of the Gaia parallax at face value for the Kepler (grey) and C3 (orange) fields. Another CMD, including a shift in parallax, is shown for Kepler (red). We removed stars having a parallax with a relative error above 10% for Kepler, and 15% for C3. The black dashed lines indicate the expected range of values for the magnitude of the clump in the K band.
Current usage metrics show cumulative count of Article Views (full-text article views including HTML views, PDF and ePub downloads, according to the available data) and Abstracts Views on Vision4Press platform.
Data correspond to usage on the plateform after 2015. The current usage metrics is available 48-96 hours after online publication and is updated daily on week days.
Initial download of the metrics may take a while.