Fig. A.1
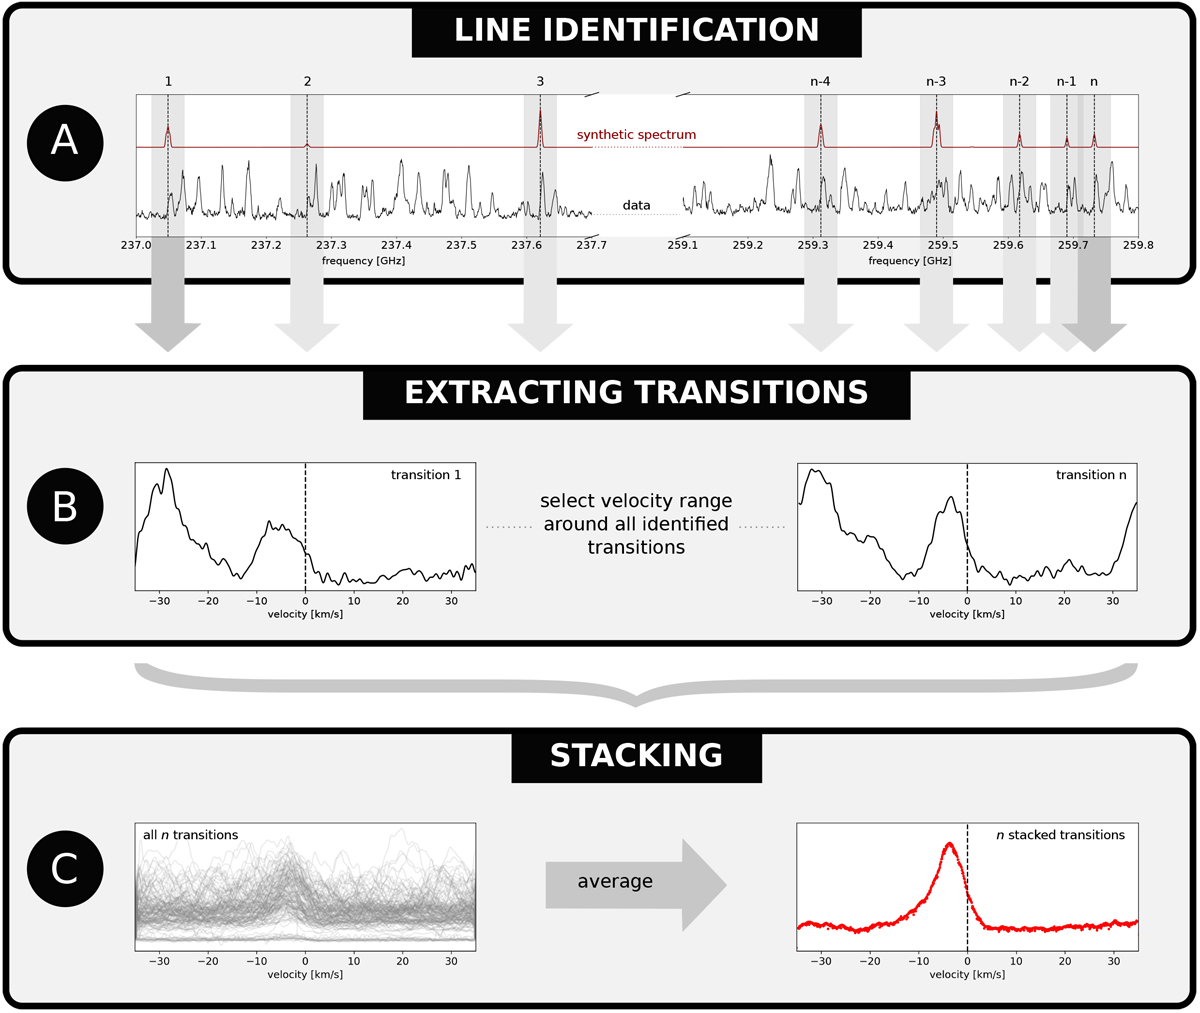
Line stacking process for molecular lines in a spectral survey. Step A: correct observed spectrum, shown in black in the top, by the source LSR velocity (corresponding to 64 km s−1 for Sgr B2(N)). Create a synthetic spectrum (shown in red, and using XCLASS) for the considered molecular species. This will beused for the identification of detectable transitions (highlighted with a gray shadow area). Step B: extract a portion of the spectrum centered at each transition, and transform the frequency axis into velocity using the Doppler equation. Each cutout spectra is uniformly resampled and rebined. Step C: sum up all the cutout spectra and divide by the number of transitions. Normalization has been waived to prevent that noise and lines from other molecular species are not scaled up. Line blendings are statistically averaged out and the true line shape and the velocity can be determined.
Current usage metrics show cumulative count of Article Views (full-text article views including HTML views, PDF and ePub downloads, according to the available data) and Abstracts Views on Vision4Press platform.
Data correspond to usage on the plateform after 2015. The current usage metrics is available 48-96 hours after online publication and is updated daily on week days.
Initial download of the metrics may take a while.