Fig. 8
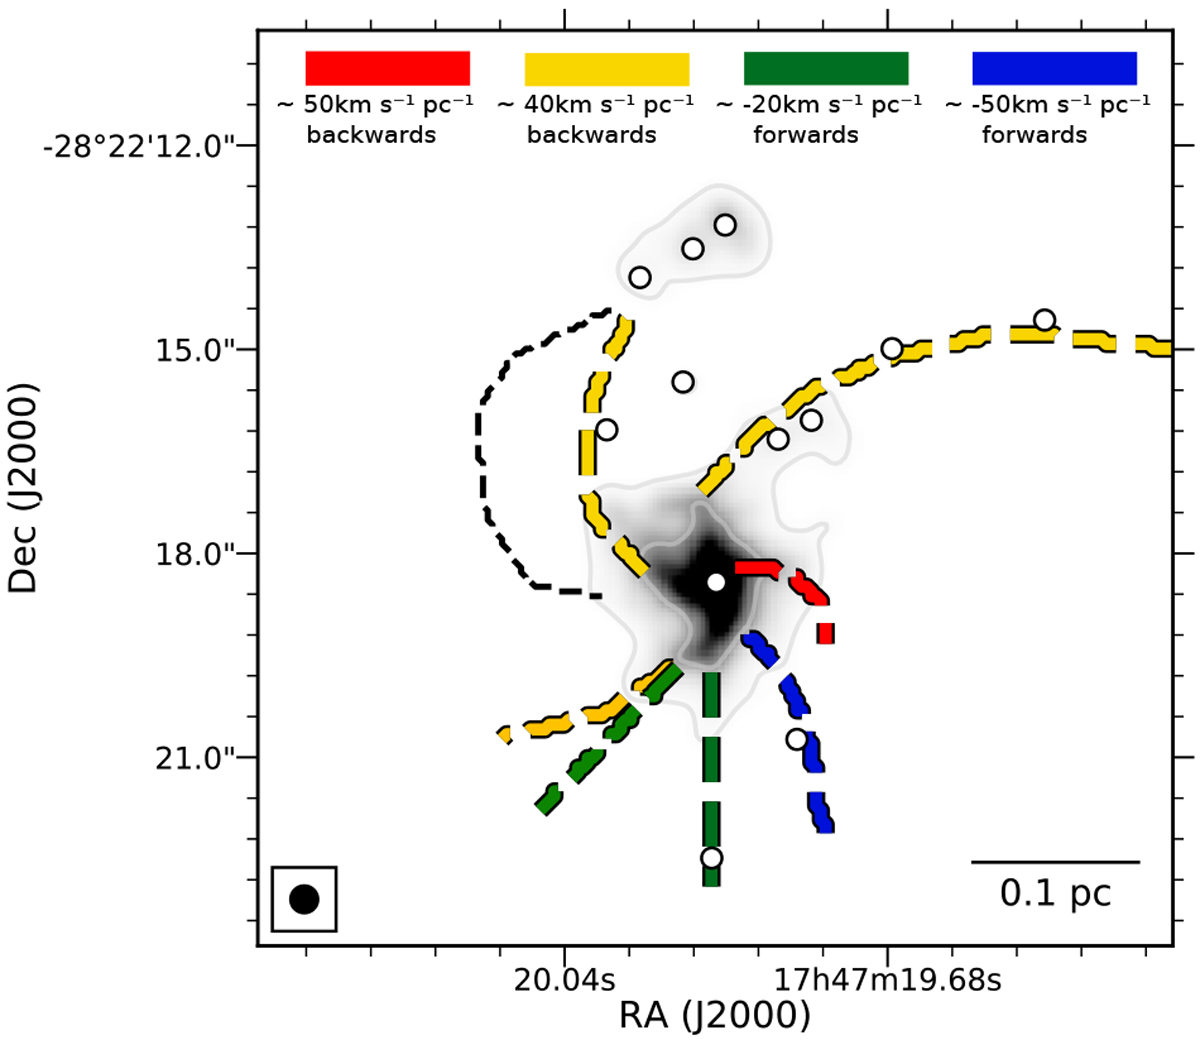
Filaments in Sgr B2(N) colored by their mean velocity gradient as derived for the molecular species CH3OCHO, CH3OCH3, CH3OH and 13CH3OH. The velocity gradient ranges from −50 km s−1 pc−1 (blue), corresponding to filaments located in front, to +50 km s−1 pc−1 (red), corresponding to filaments located in the back. The gray contours indicating 242 GHz continuum emission at a level of 1.2 Jy beam−1. The white circles represent the dense cores, and the black dashed line shows the filament F02, only visible in H2 CS.
Current usage metrics show cumulative count of Article Views (full-text article views including HTML views, PDF and ePub downloads, according to the available data) and Abstracts Views on Vision4Press platform.
Data correspond to usage on the plateform after 2015. The current usage metrics is available 48-96 hours after online publication and is updated daily on week days.
Initial download of the metrics may take a while.