Fig. 4
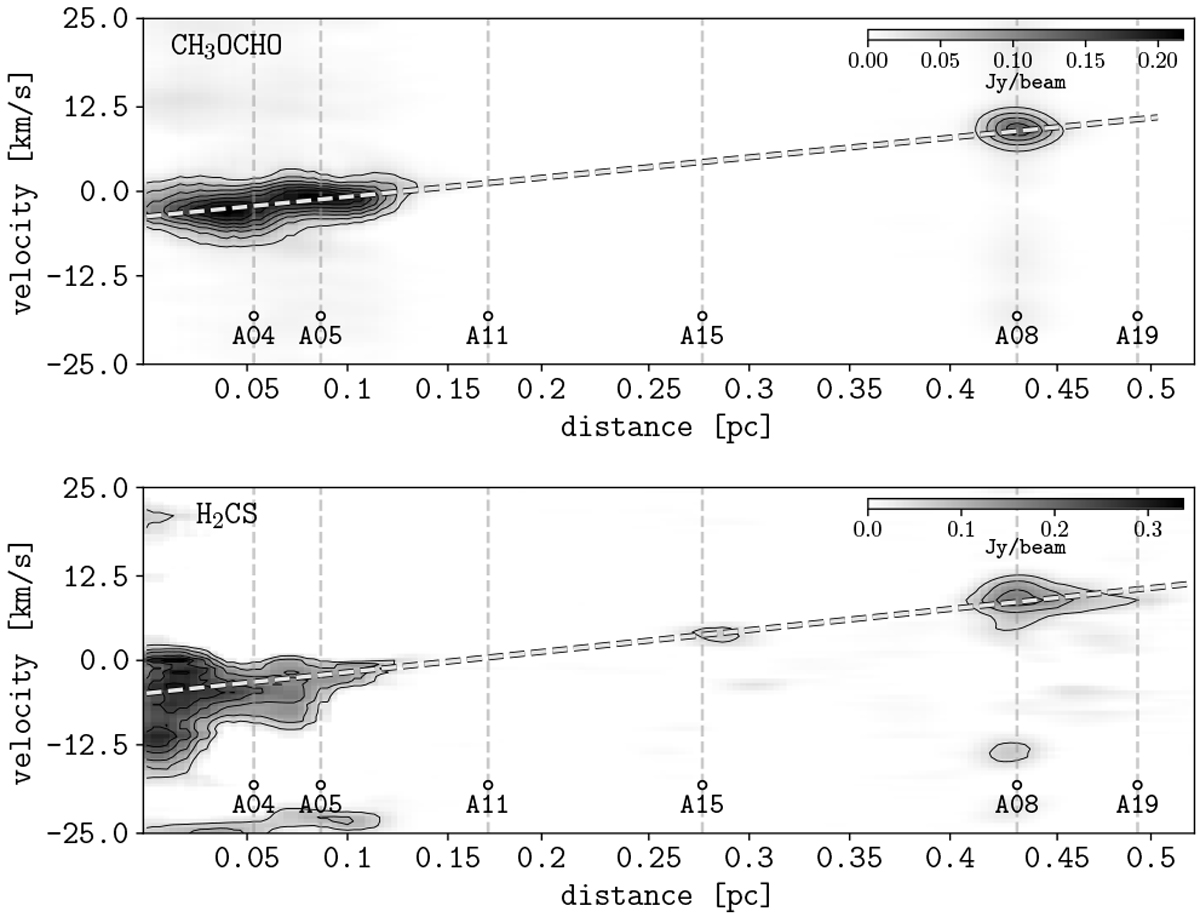
Position velocity cut along filament F08 in CH3OCHO and H2 CS. The emission to the left corresponds to the filament close to the central hub. The emission at about 0.25 pc and 0.4 pc corresponds to the cores A15 and A08, A19. The white dashed line corresponds to a velocity gradient of ~16 km s−1 pc−1, consistent with the mean velocity gradient of F08 (see Table 2).
Current usage metrics show cumulative count of Article Views (full-text article views including HTML views, PDF and ePub downloads, according to the available data) and Abstracts Views on Vision4Press platform.
Data correspond to usage on the plateform after 2015. The current usage metrics is available 48-96 hours after online publication and is updated daily on week days.
Initial download of the metrics may take a while.