Free Access
Fig. 3
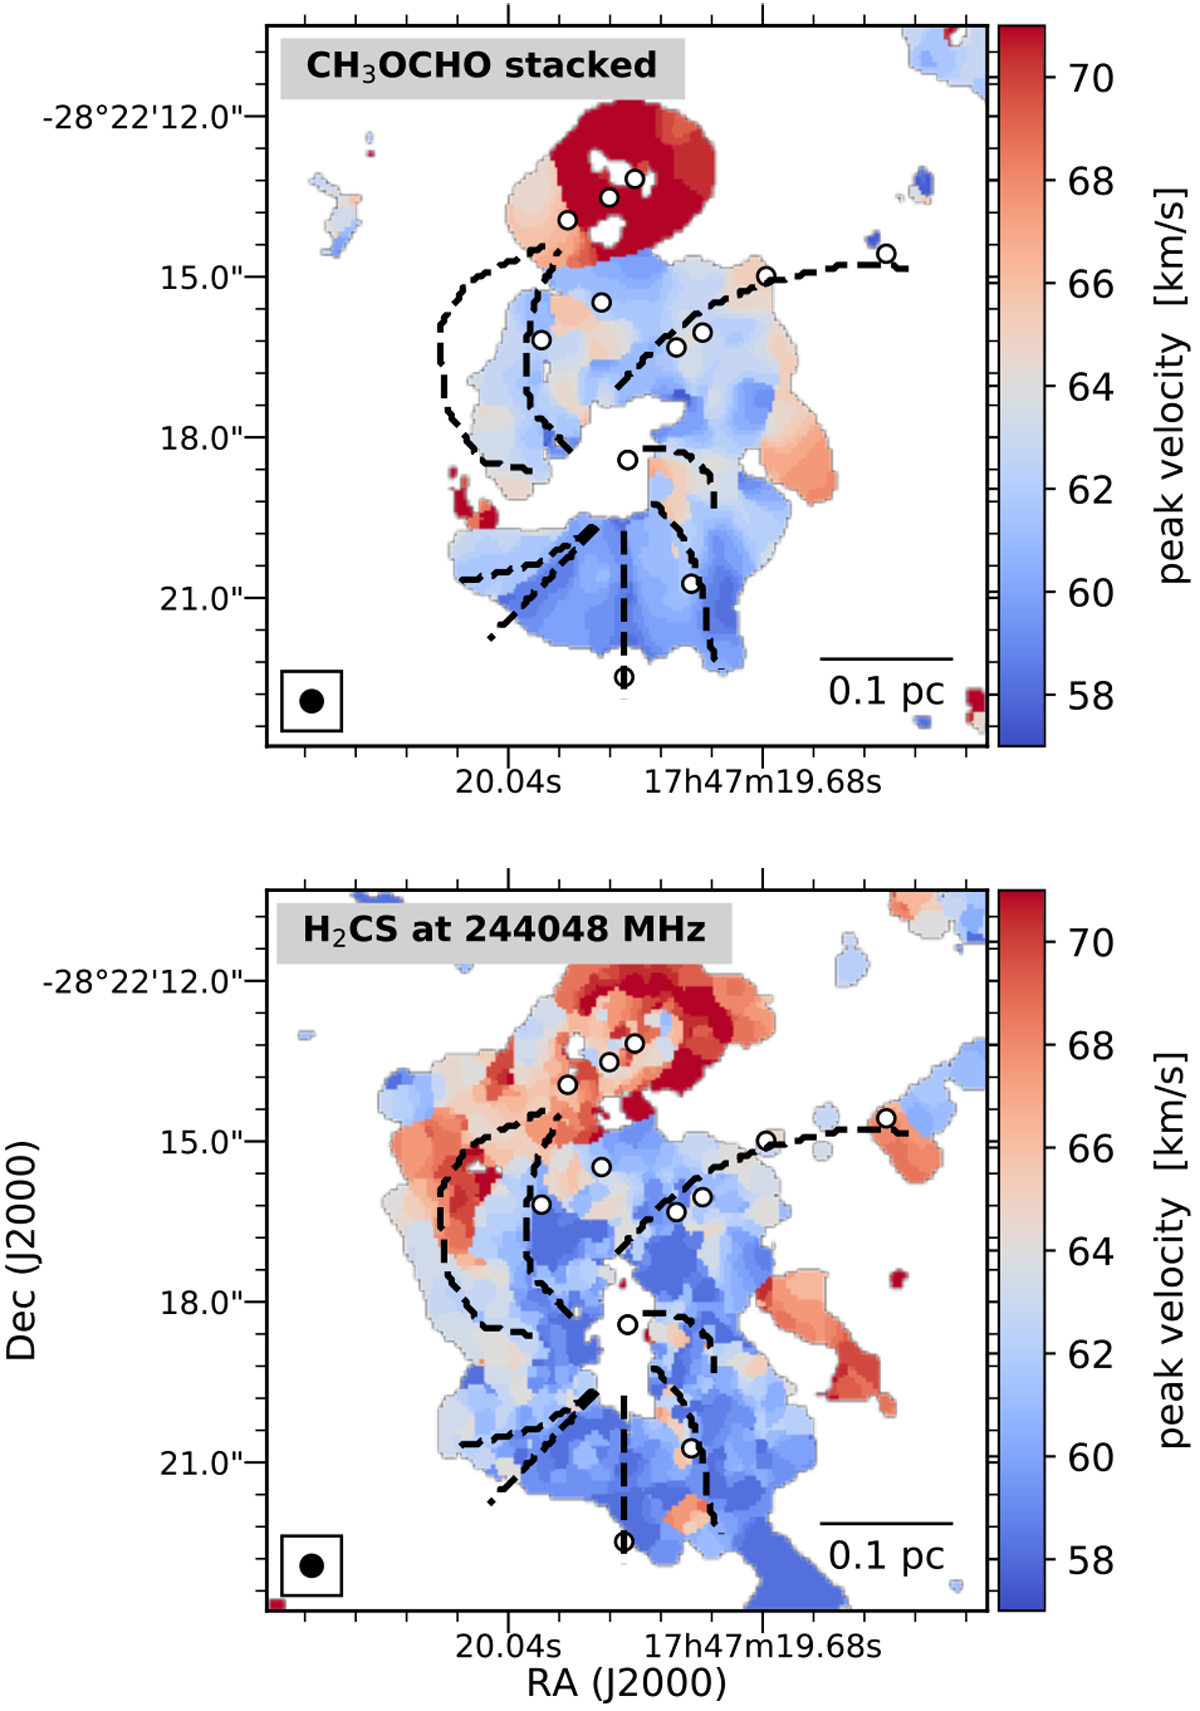
Peak velocity map of H2CS (bottom-panel) and CH3OCHO (top-panel, using 143 stacked lines, see Appendix A). The emission below 10σ and the center are masked out. The filaments and position of dense cores are marked with black dashed lines and white dots, respectively.
Current usage metrics show cumulative count of Article Views (full-text article views including HTML views, PDF and ePub downloads, according to the available data) and Abstracts Views on Vision4Press platform.
Data correspond to usage on the plateform after 2015. The current usage metrics is available 48-96 hours after online publication and is updated daily on week days.
Initial download of the metrics may take a while.