Free Access
Fig. F.3
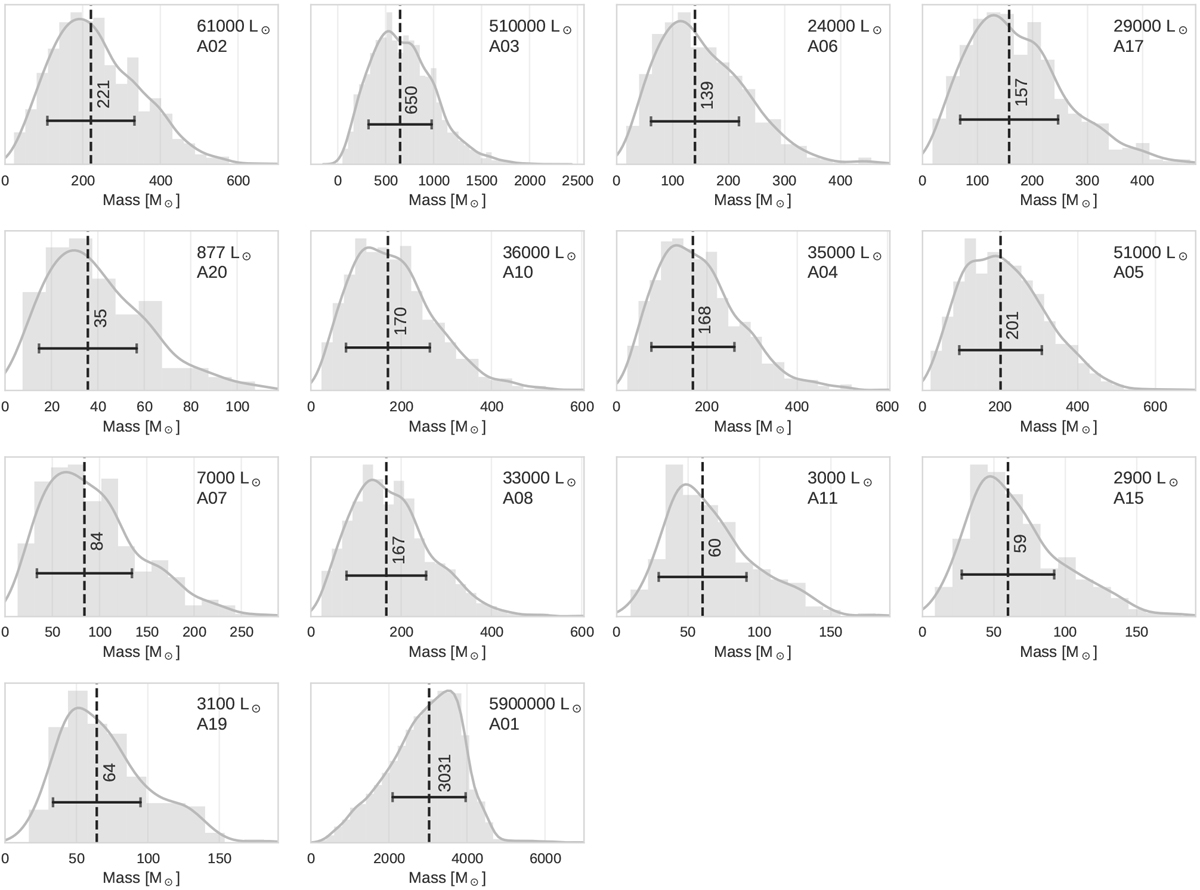
Stellar mass distribution of clusters with luminosities according to the observed dense cores in Sgr B2(N). The gray line shows the KDE obtained with the python package seaborn. The black dashed vertical lines indicate the mean values of the mass distribution, and the horizontal lines indicate the standard deviation.
Current usage metrics show cumulative count of Article Views (full-text article views including HTML views, PDF and ePub downloads, according to the available data) and Abstracts Views on Vision4Press platform.
Data correspond to usage on the plateform after 2015. The current usage metrics is available 48-96 hours after online publication and is updated daily on week days.
Initial download of the metrics may take a while.