Fig. F.2
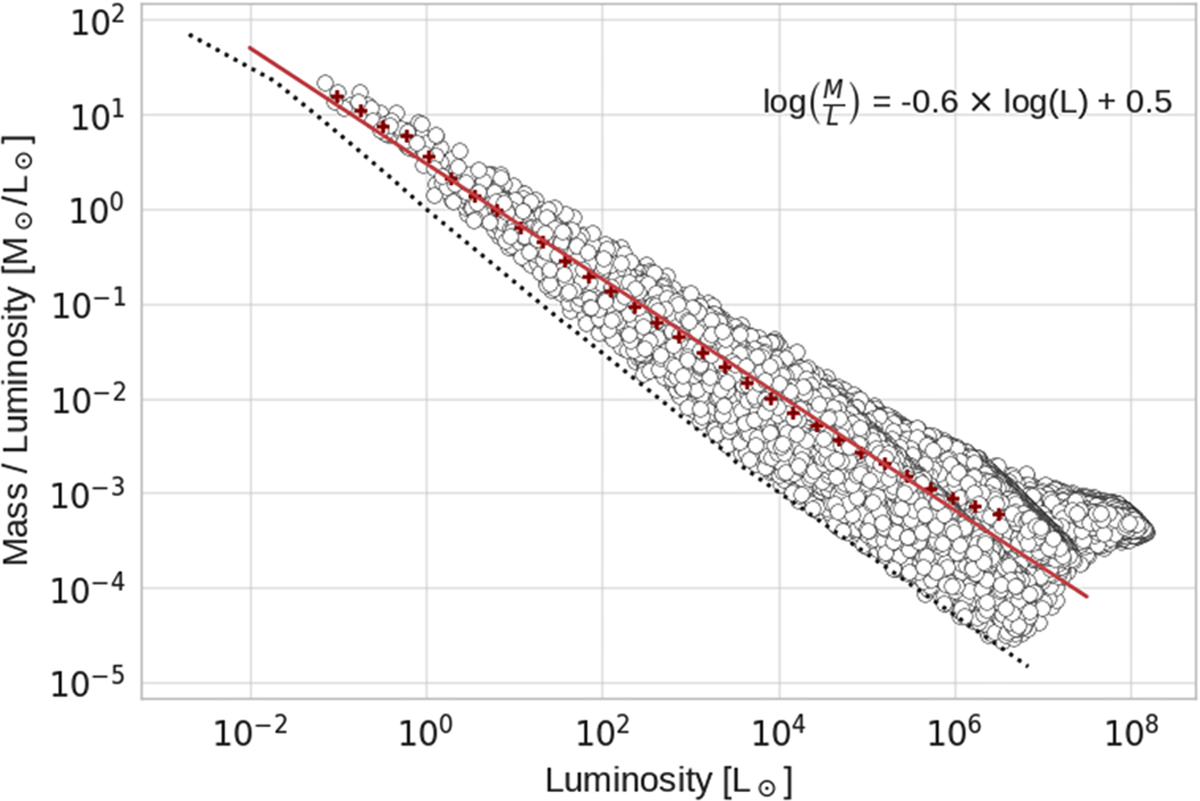
Relation between the ratio ![]() with the cluster luminosity. The white circles show all simulated clusters and the red crosses are the mean values of
with the cluster luminosity. The white circles show all simulated clusters and the red crosses are the mean values of
![]() for different luminosities. The red line indicates a linear fit through the mean values. The black dashed line shows the relation between luminosity and mass for a single star (see Eq. (F.2))
for different luminosities. The red line indicates a linear fit through the mean values. The black dashed line shows the relation between luminosity and mass for a single star (see Eq. (F.2))
Current usage metrics show cumulative count of Article Views (full-text article views including HTML views, PDF and ePub downloads, according to the available data) and Abstracts Views on Vision4Press platform.
Data correspond to usage on the plateform after 2015. The current usage metrics is available 48-96 hours after online publication and is updated daily on week days.
Initial download of the metrics may take a while.