Fig. 2
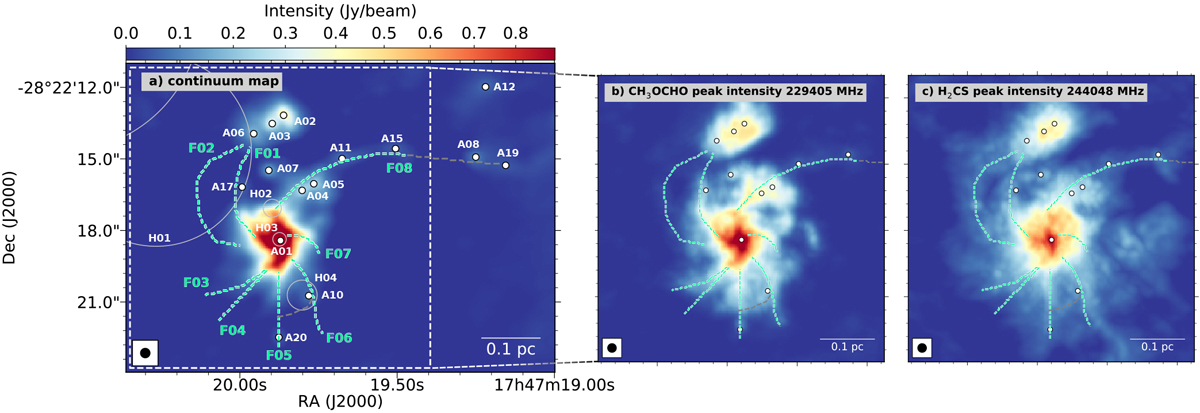
Panel a: map of the ALMA 242 GHz continuum emission of Sgr B2(N). The white dots indicate the position of the continuum sources reported in Paper II. The green dashed lines trace the path of the filaments identified inthe molecular line data (see Sect. 3.1), while gray dashed lines trace tentative elongated structures not clearly confirmed in the molecular emission maps. The light-gray circles indicate H II regions (see De Pree et al. 2014, and Paper I). Panel b: peak intensity map of the bright, isolated transition of CH3OCHO at 229.404 GHz. Panel c: peak intensity map of the bright H2CS transition at 244.048 GHz. In all panels, the synthesized beam of 0.′′4 is shown in the bottom-left corner, and a spatial scale bar is shown in the bottom-right corner.
Current usage metrics show cumulative count of Article Views (full-text article views including HTML views, PDF and ePub downloads, according to the available data) and Abstracts Views on Vision4Press platform.
Data correspond to usage on the plateform after 2015. The current usage metrics is available 48-96 hours after online publication and is updated daily on week days.
Initial download of the metrics may take a while.