Fig. E.1
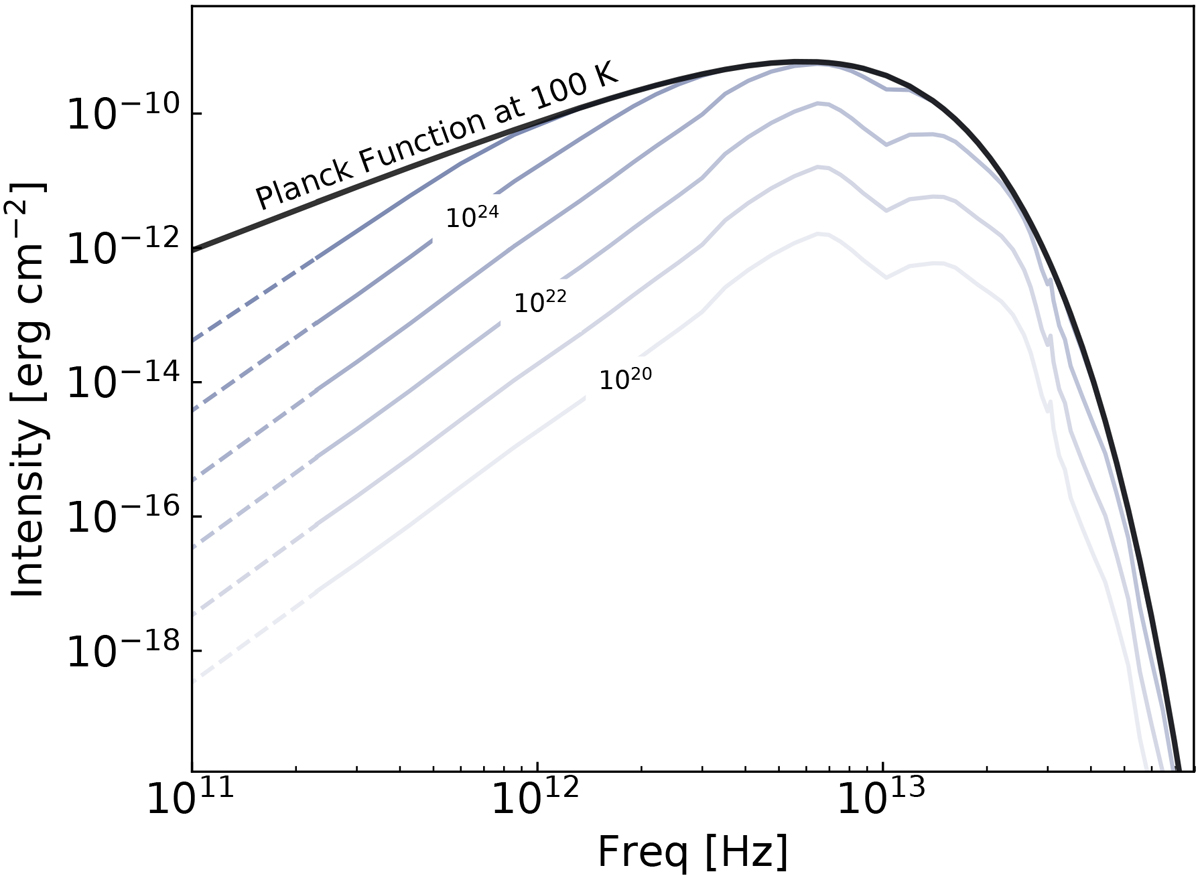
Modified Planck function for different column densities from 1020 to 1025 cm−2 at a temperature of 100 K. The solid gray curves are calculated based on the opacities of Ossenkopf & Henning (1994), while the dashed lines are obtained from the extrapolation of the two lowest frequency values in Ossenkopf & Henning (1994). The Planck function or perfect black body at a temperature of 100 K is shown with a black solid and thick line.
Current usage metrics show cumulative count of Article Views (full-text article views including HTML views, PDF and ePub downloads, according to the available data) and Abstracts Views on Vision4Press platform.
Data correspond to usage on the plateform after 2015. The current usage metrics is available 48-96 hours after online publication and is updated daily on week days.
Initial download of the metrics may take a while.