Fig. D.1
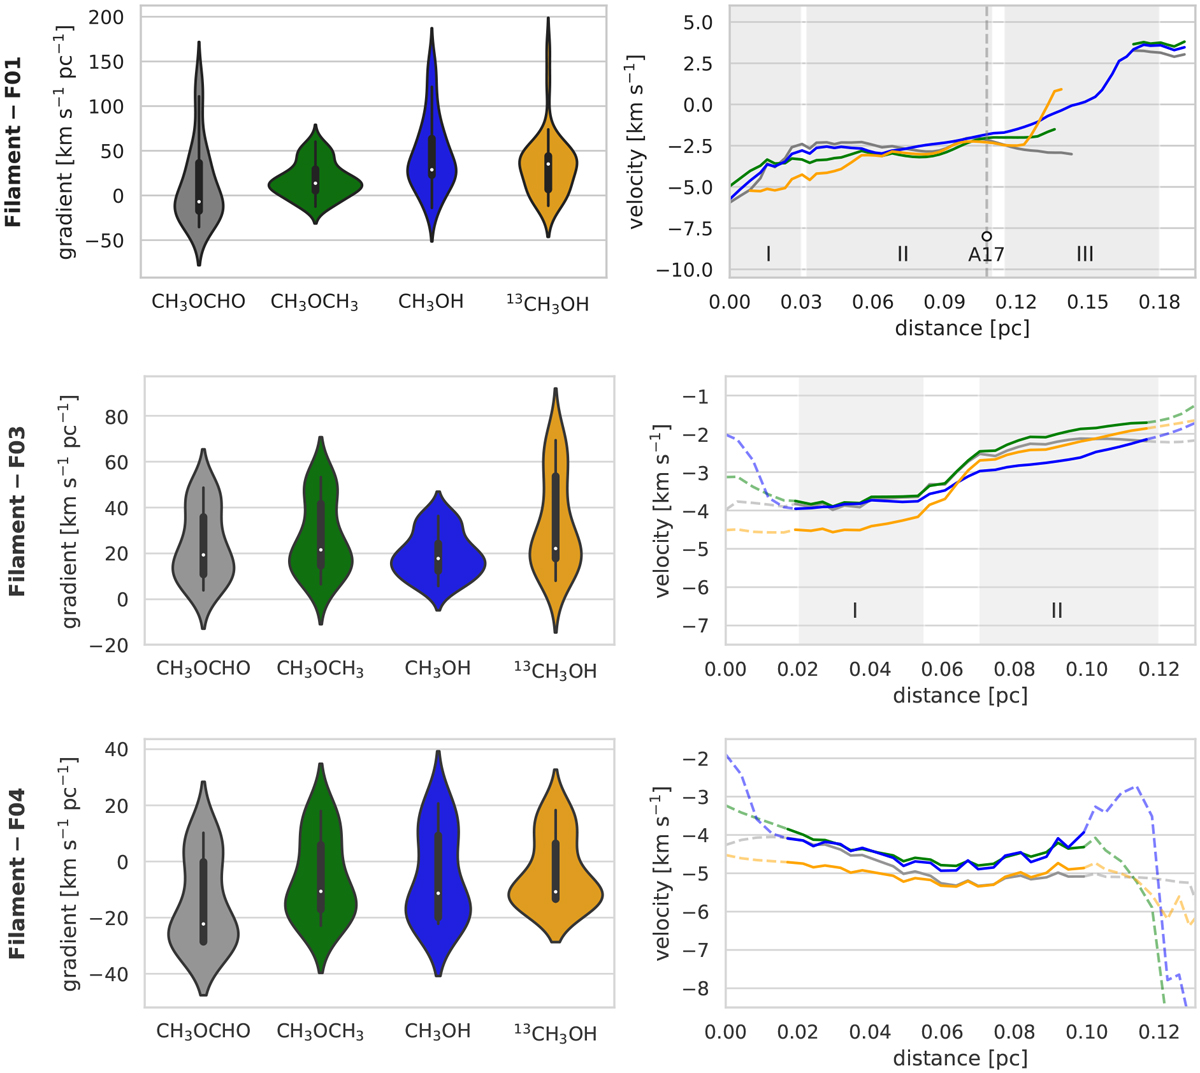
Left panels: distribution of velocity gradients along the filaments (determined in sections of 0.014 pc) shown in form of a violin plot. The outer (or violin) shape represents all possible velocity gradients, with broadening indicating how common they are, meaning that the broadest part represents the mode average. The black thin bar indicates all datapoints in the violin interior, while its thicker part corresponds to the quartiles of the distribution, with the white dot indicating the mean value of all velocity gradients along the respective filament. The distribution is shown for the molecules CH3OCHO, CH3OCH3, CH3OH and 13CH3OH. Right panel: velocity variation along the filaments. The gray areas indicate subsections along the filaments, labeled with roman numbers. The position of the dense cores are indicatedby vertical, black dashed lines. Regions where the line emission is below 4σ are plotted with dashed lines.
Current usage metrics show cumulative count of Article Views (full-text article views including HTML views, PDF and ePub downloads, according to the available data) and Abstracts Views on Vision4Press platform.
Data correspond to usage on the plateform after 2015. The current usage metrics is available 48-96 hours after online publication and is updated daily on week days.
Initial download of the metrics may take a while.