Fig. 1
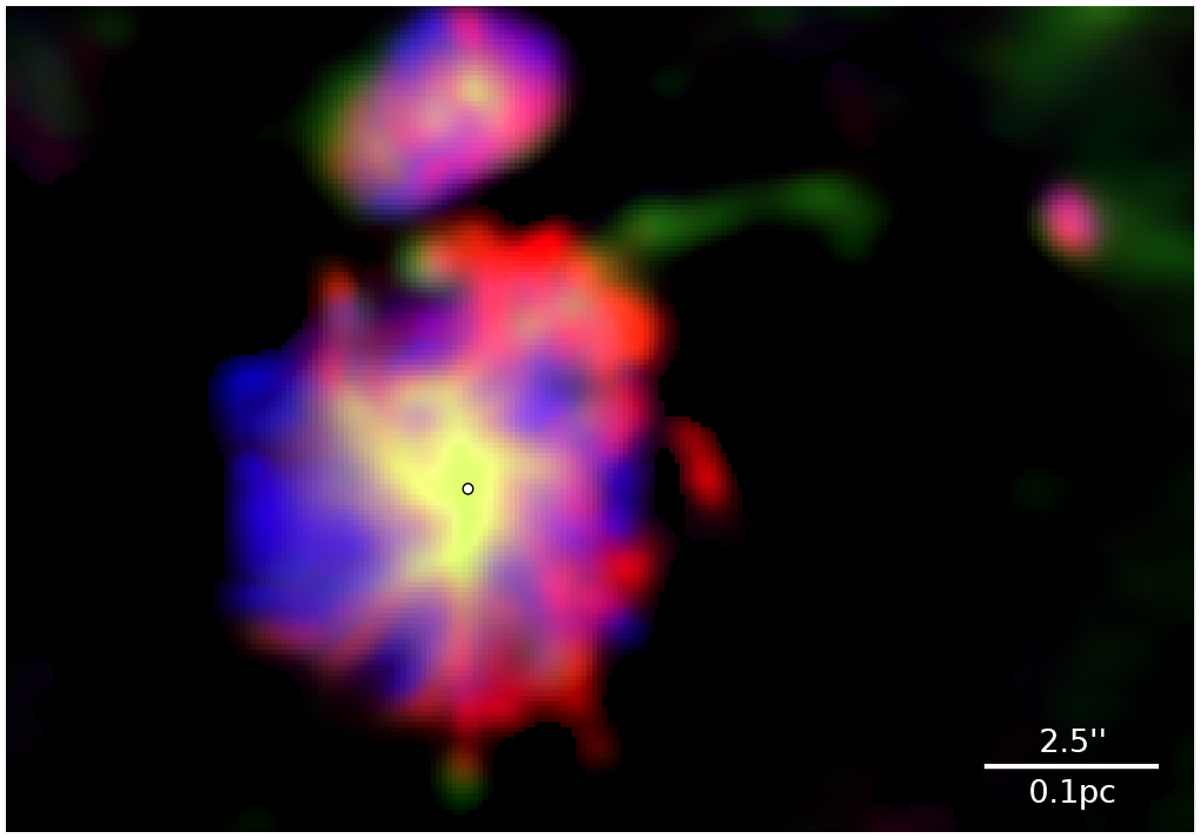
Three-color composite image of Sgr B2(N). The green image shows the continuum emission at 242 GHz (Paper II), the red image corresponds to the molecular species CH3 OCHO, and the blue image to C2H5CN. The center, which is dominated by the continuum and CH3OCHO emission, appears yellow. The images of the molecular species have been constructed from stacked cubes (see more details in Sect. 3 and Appendix A) and correspond to peak intensity maps. The continuum emission and species like CH3 OCHO trace a filamentary structure, while species such as C2H5CN show a spherical or bubble-like shape. The white circle indicates the position of the central core with coordinates α(J2000) = 17h47m19s.87, δ(J2000) = −28°22′18.′′43.
Current usage metrics show cumulative count of Article Views (full-text article views including HTML views, PDF and ePub downloads, according to the available data) and Abstracts Views on Vision4Press platform.
Data correspond to usage on the plateform after 2015. The current usage metrics is available 48-96 hours after online publication and is updated daily on week days.
Initial download of the metrics may take a while.