Fig. 3
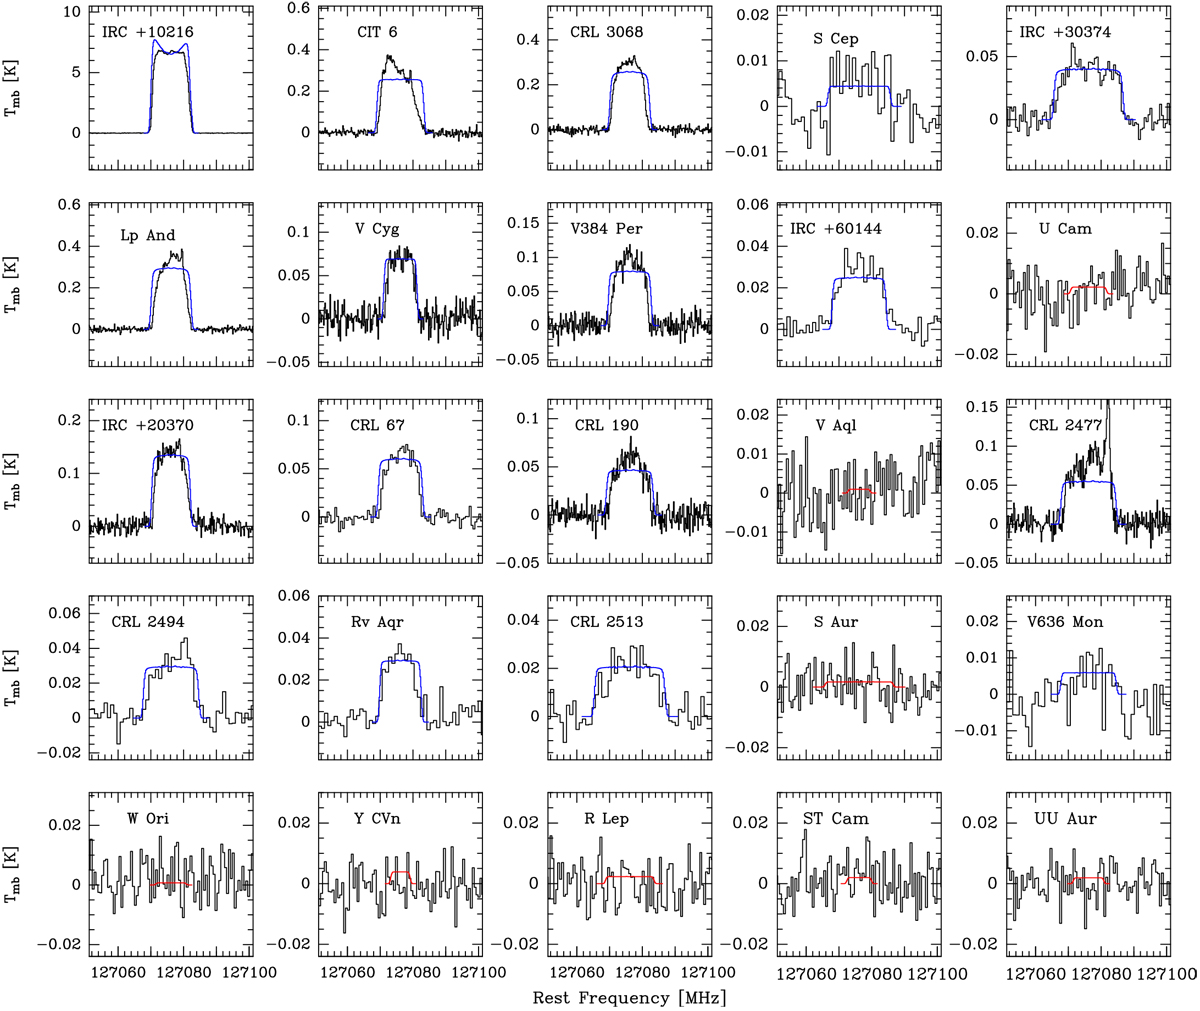
SiS J = 7−6 line observed with the IRAM 30 m telescope in the 25 carbon stars (black histograms). The blue lines indicate the calculated line profiles from the best-fit LVG model. The SiS line is not detected in various sources, for which we plot in red the calculated line profiles with the maximum intensity compatible with the non-detection.
Current usage metrics show cumulative count of Article Views (full-text article views including HTML views, PDF and ePub downloads, according to the available data) and Abstracts Views on Vision4Press platform.
Data correspond to usage on the plateform after 2015. The current usage metrics is available 48-96 hours after online publication and is updated daily on week days.
Initial download of the metrics may take a while.