Free Access
Fig. 11
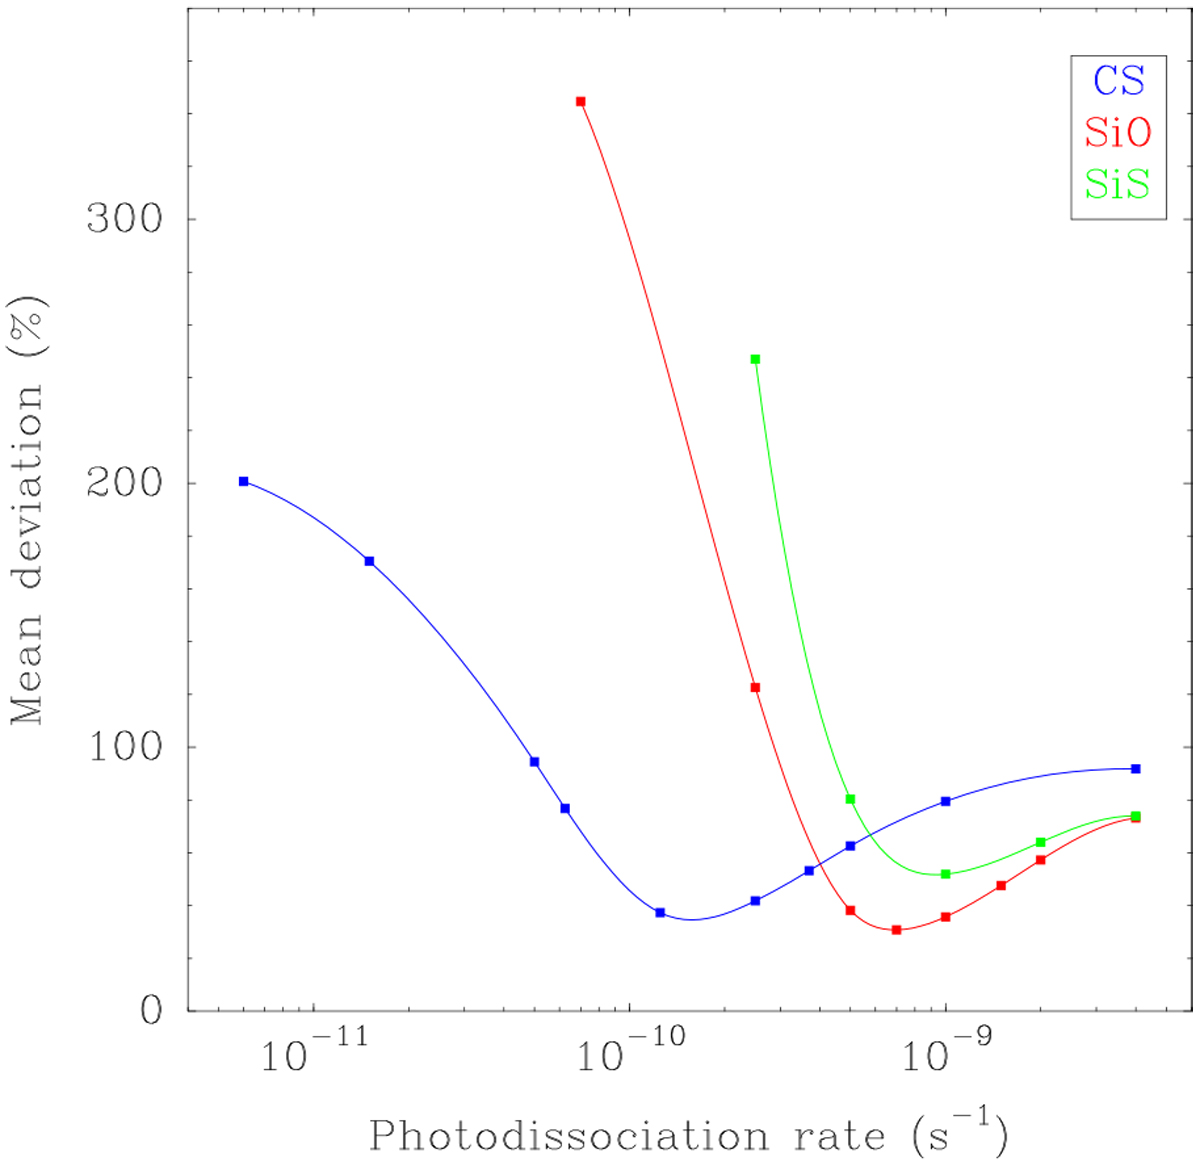
The mean deviation between the calculated line areas with the photodissociation model and the model using empirical laws is plotted as a function of the unattenuated photodissociation rate adopted in the photodissociation model for CS, SiO,and SiS.
Current usage metrics show cumulative count of Article Views (full-text article views including HTML views, PDF and ePub downloads, according to the available data) and Abstracts Views on Vision4Press platform.
Data correspond to usage on the plateform after 2015. The current usage metrics is available 48-96 hours after online publication and is updated daily on week days.
Initial download of the metrics may take a while.