Fig. 1
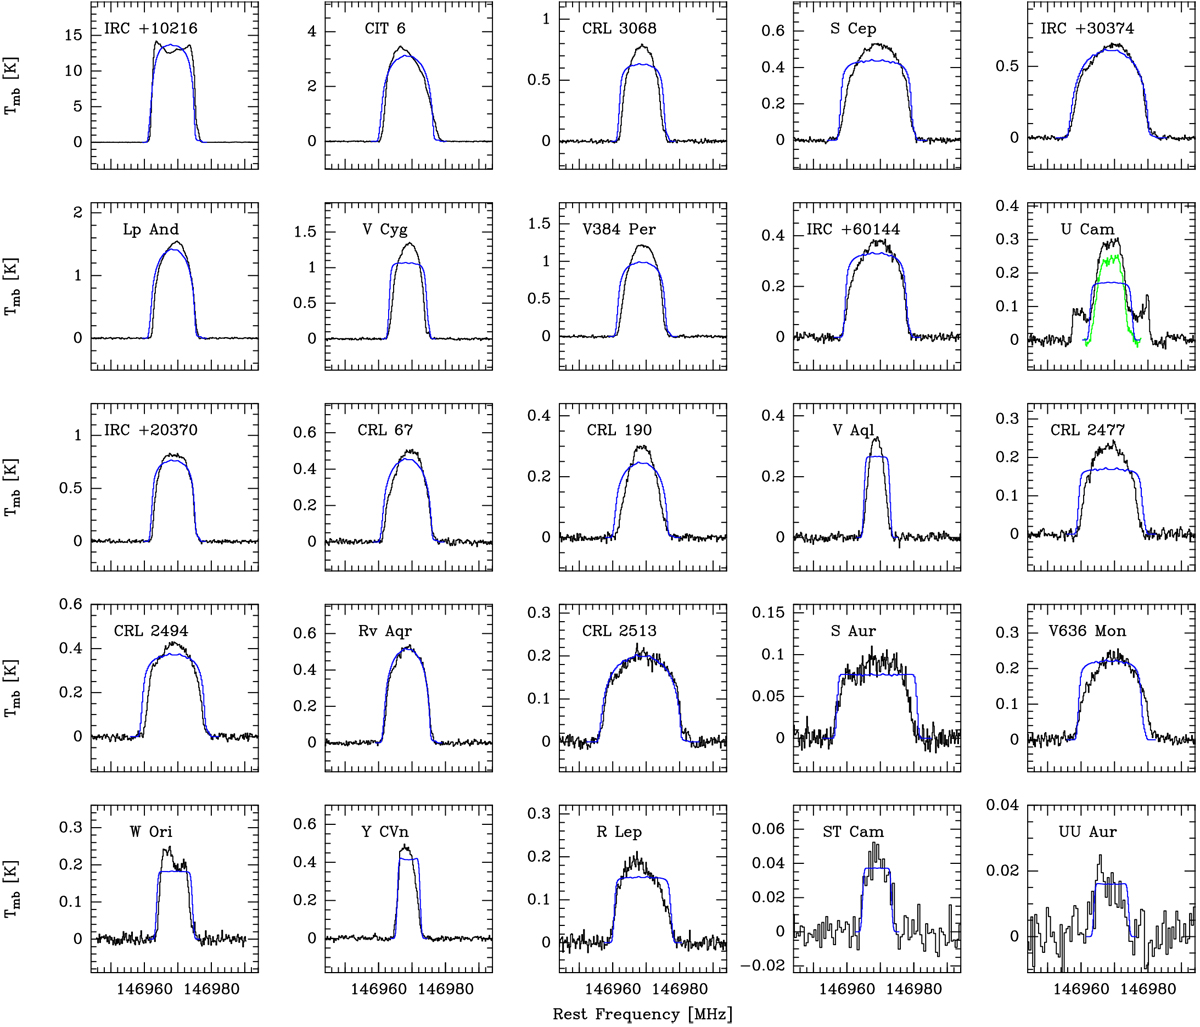
CS J = 3−2 line observed with the IRAM 30 m telescope in the 25 carbon stars (black histograms). U Cam shows emission contribution from the present day wind and the detached envelope. The green histogram corresponds to the observed line profile in which a fit to the detached envelope contribution (the wider one) has been subtracted. The blue lines indicate the calculated line profiles from the best-fit LVG model.
Current usage metrics show cumulative count of Article Views (full-text article views including HTML views, PDF and ePub downloads, according to the available data) and Abstracts Views on Vision4Press platform.
Data correspond to usage on the plateform after 2015. The current usage metrics is available 48-96 hours after online publication and is updated daily on week days.
Initial download of the metrics may take a while.