Fig. 7.
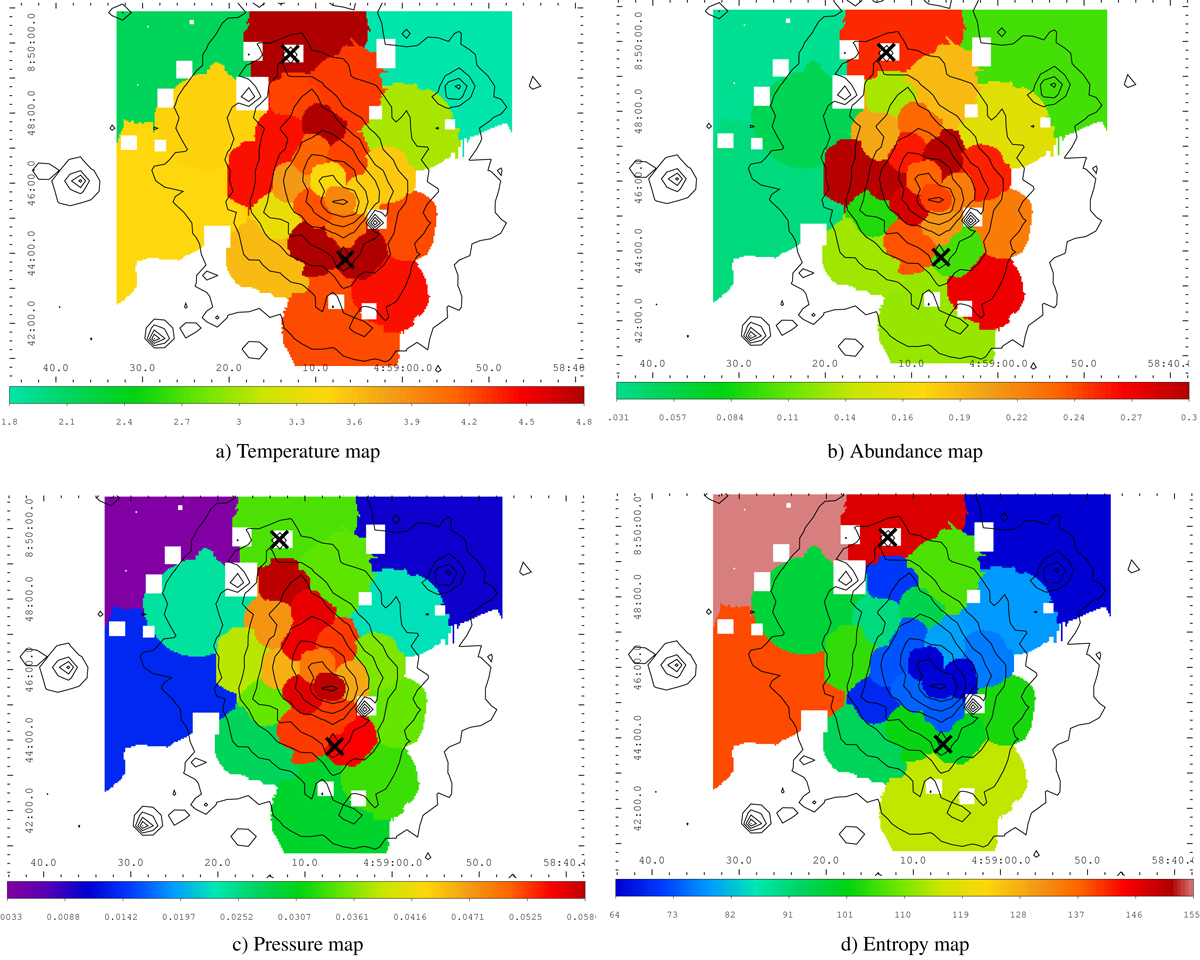
Thermodynamic maps of A523. Panel a: temperature map (keV); panel b: metal abundance map (Z⊙); panel c: pseudo-pressure map (arbitrary units); panel d: pseudo-entropy map (arbitrary units). Overlaid to each image are the surface brightness contours obtained by the XMM-Newton image and the positions of the two brightest cluster galaxies are indicated by two black crosses.
Current usage metrics show cumulative count of Article Views (full-text article views including HTML views, PDF and ePub downloads, according to the available data) and Abstracts Views on Vision4Press platform.
Data correspond to usage on the plateform after 2015. The current usage metrics is available 48-96 hours after online publication and is updated daily on week days.
Initial download of the metrics may take a while.