Free Access
Fig. 6.
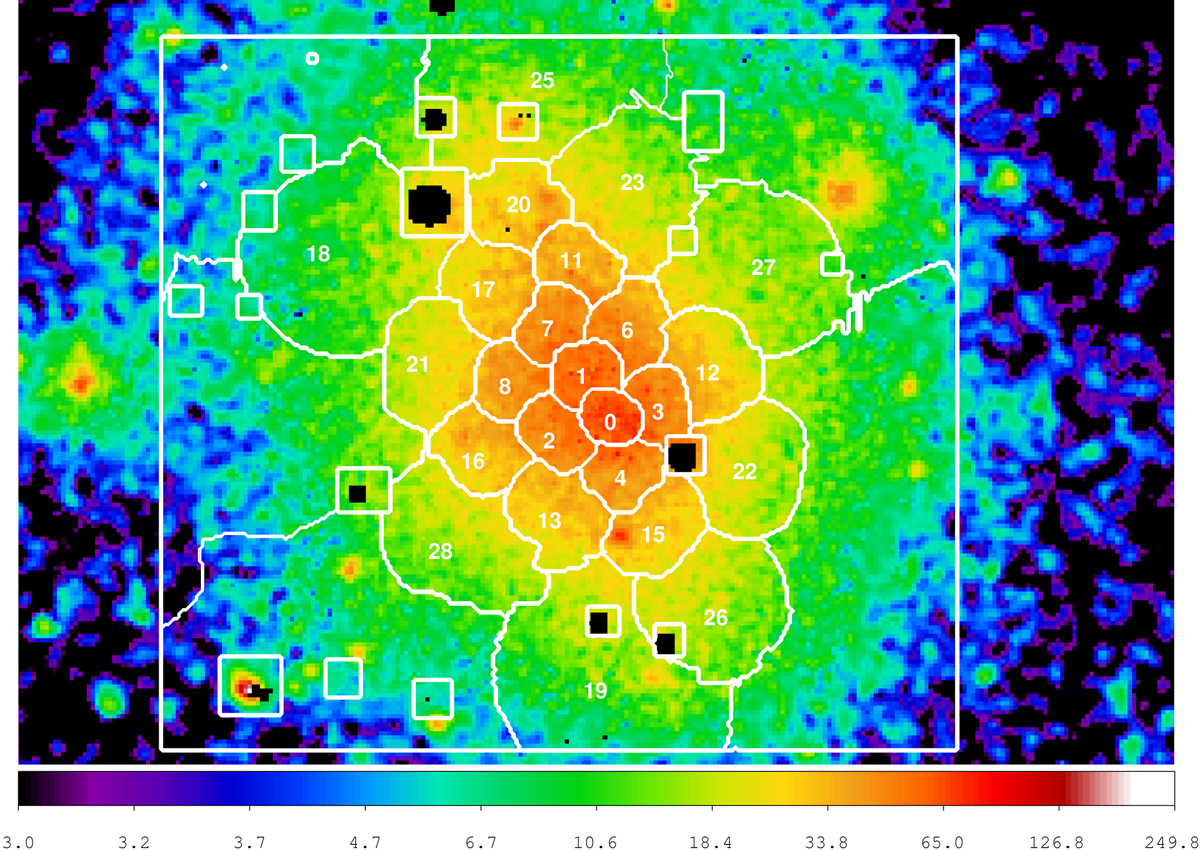
Regions individuated from contbin overlaid to the XMM-Newton surface brightness image, numbered in order of creation. For each region we performed a spectral analysis to build the thermodynamic maps presented in Sect. 5.
Current usage metrics show cumulative count of Article Views (full-text article views including HTML views, PDF and ePub downloads, according to the available data) and Abstracts Views on Vision4Press platform.
Data correspond to usage on the plateform after 2015. The current usage metrics is available 48-96 hours after online publication and is updated daily on week days.
Initial download of the metrics may take a while.