Free Access
Fig. B.2.
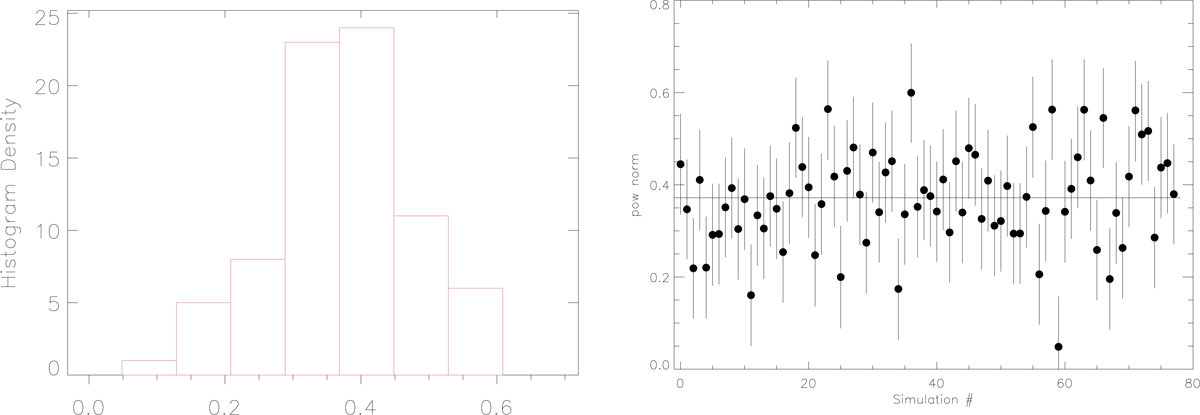
Left panel: histogram density of the IC flux in the 20−80 keV band obtained fitting a 1T+IC model for the 1T+IC simulations. Right panel: IC fluxes with error bars for each simulation, the solid black line represents the mean value, averaged over all the simulations.
Current usage metrics show cumulative count of Article Views (full-text article views including HTML views, PDF and ePub downloads, according to the available data) and Abstracts Views on Vision4Press platform.
Data correspond to usage on the plateform after 2015. The current usage metrics is available 48-96 hours after online publication and is updated daily on week days.
Initial download of the metrics may take a while.