Fig. A.5.
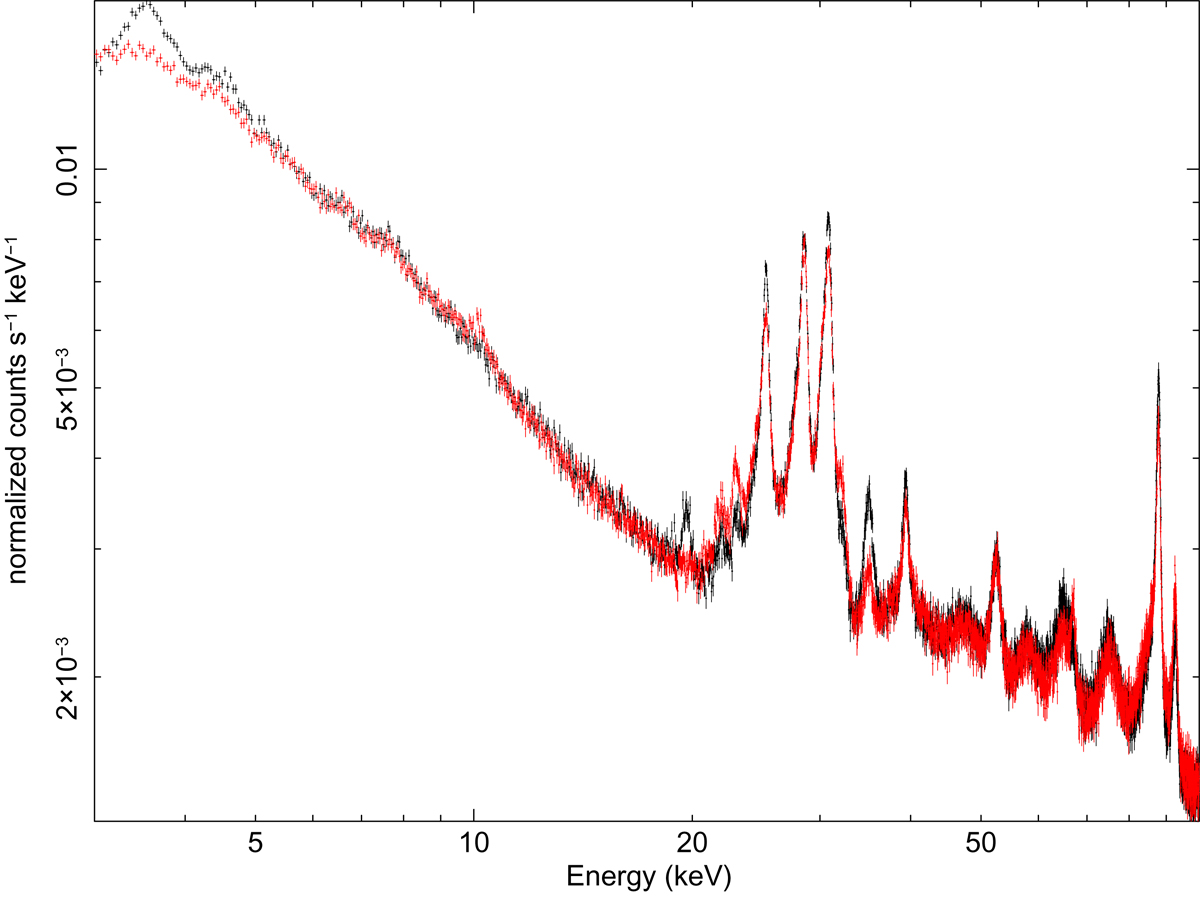
Comparison between the background spectra produced using the models from the two different methods of background estimation: fixed method (red) and corner method (black). The spectra in this image refer to a central circular region of 5 arcmin, covering the majority of the cluster emission, and for telescope A, ObsID 7012001004.
Current usage metrics show cumulative count of Article Views (full-text article views including HTML views, PDF and ePub downloads, according to the available data) and Abstracts Views on Vision4Press platform.
Data correspond to usage on the plateform after 2015. The current usage metrics is available 48-96 hours after online publication and is updated daily on week days.
Initial download of the metrics may take a while.