Free Access
Fig. A.3.
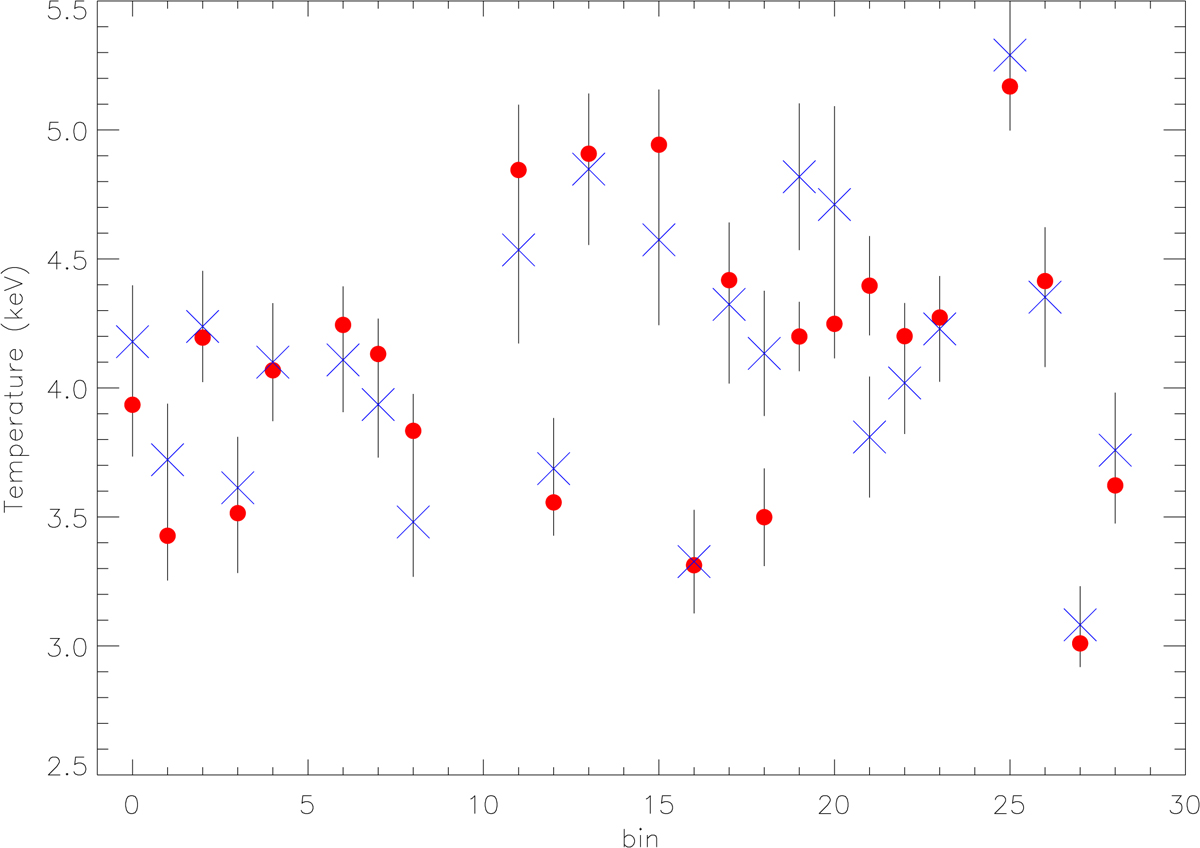
Comparison between the best-fit temperature parameter extracted from the spectral analysis performed on the regions used for the XMM thermodynamic maps, using both subtracting the ESAS-produced instrumental background (blue crosses) and the background modeling procedure described in this paper (red points).
Current usage metrics show cumulative count of Article Views (full-text article views including HTML views, PDF and ePub downloads, according to the available data) and Abstracts Views on Vision4Press platform.
Data correspond to usage on the plateform after 2015. The current usage metrics is available 48-96 hours after online publication and is updated daily on week days.
Initial download of the metrics may take a while.