Fig. A.1.
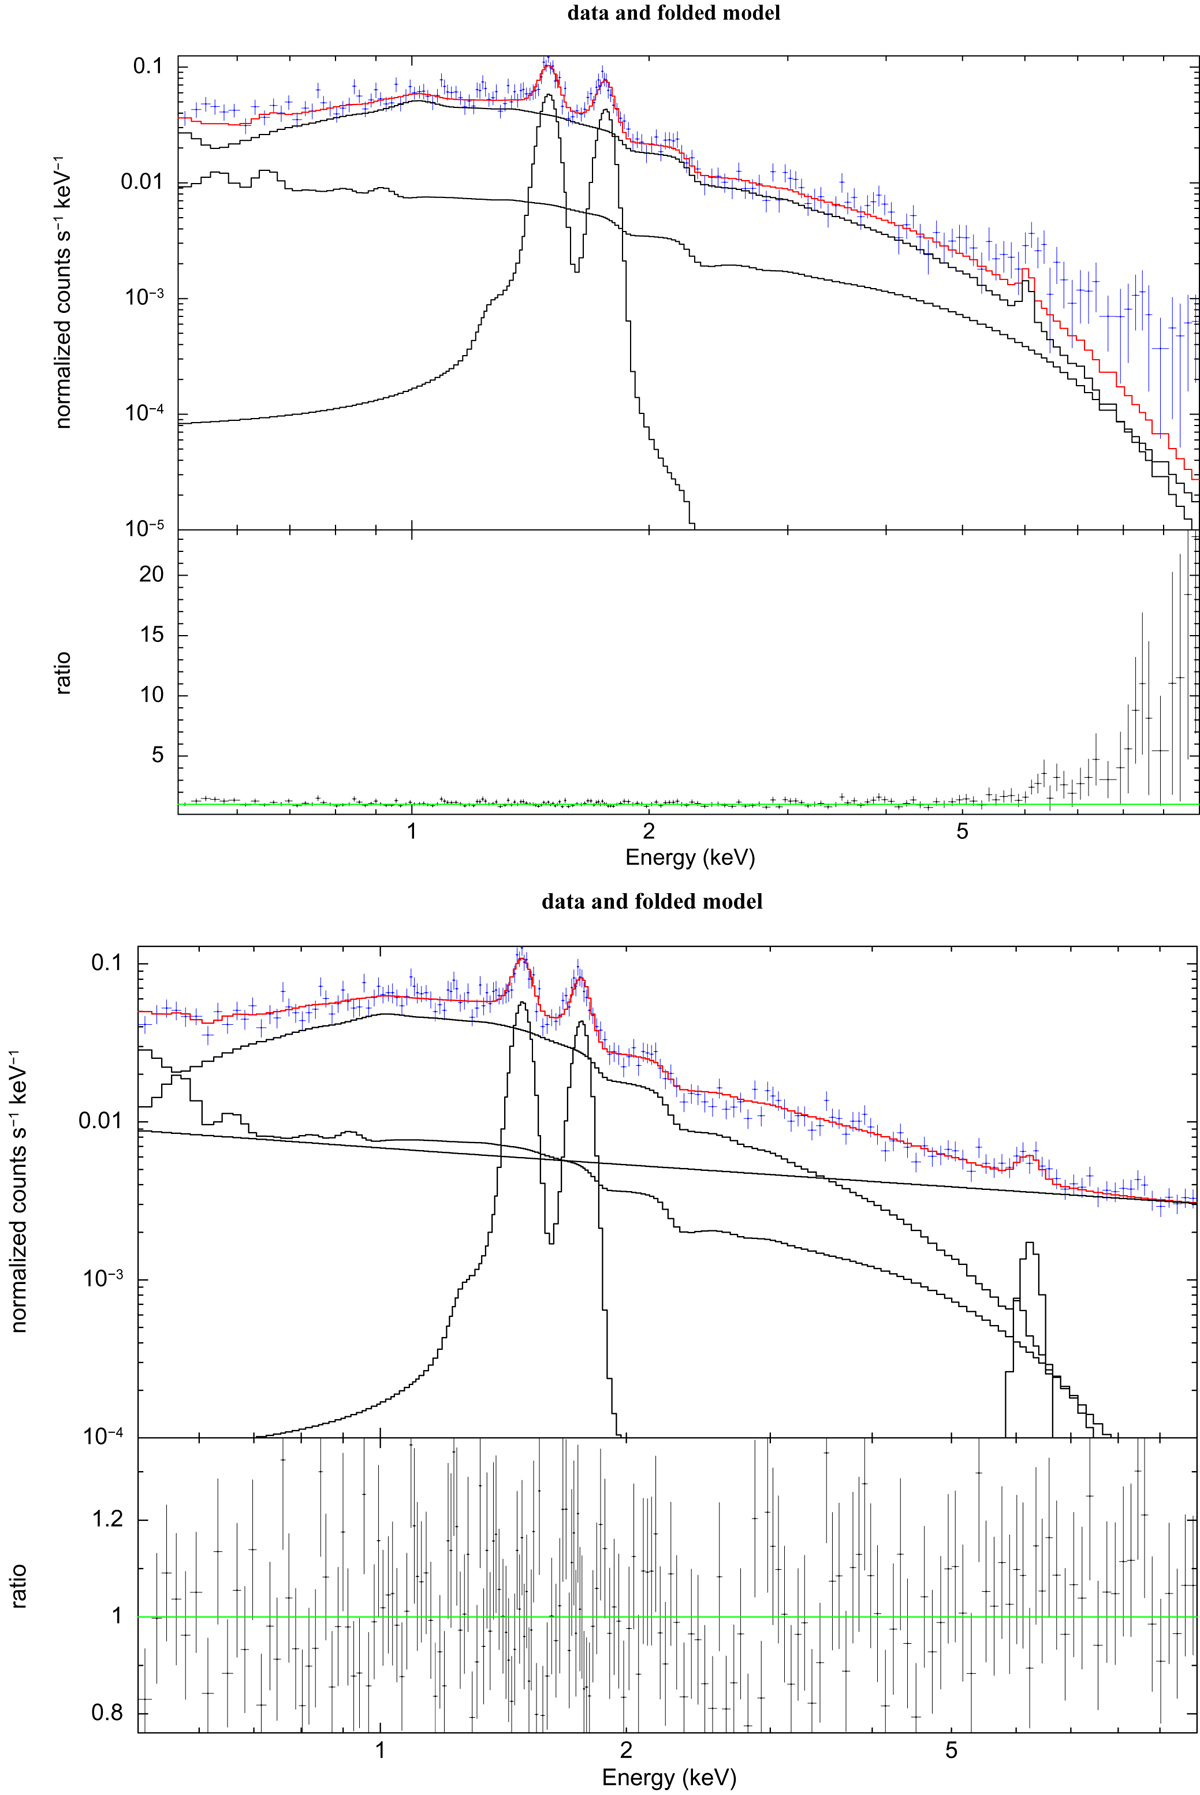
Spectral fit for the 6th annulus and for only the MOS1 instrument, performed with two different methods. Top panel: background subtraction of the ESAS-produced background spectrum. Bottom panel: using the QPB model obtained from FWC observations, obtained as described in this section. In red we show the total best-fit model. Lower panels: data to total model ratio.
Current usage metrics show cumulative count of Article Views (full-text article views including HTML views, PDF and ePub downloads, according to the available data) and Abstracts Views on Vision4Press platform.
Data correspond to usage on the plateform after 2015. The current usage metrics is available 48-96 hours after online publication and is updated daily on week days.
Initial download of the metrics may take a while.