Fig. 11.
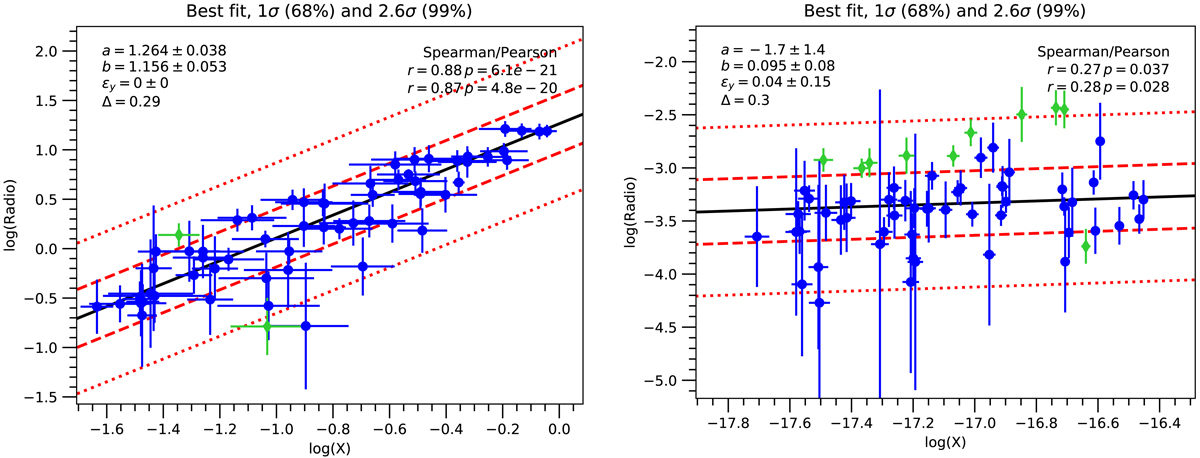
Best-fit for the radio-X-ray surface brightnesses relation with the lts-linefit method by Cappellari et al. (2013) for the clusters A2744 (left panel) and A523 (right panel). Best-fit parameters and observed intrinsic scatter Δ are indicated in the upper left corner. Red dashed lines indicate 1σ confidence levels, while red dotted lines indicate the 2.6σ confidence levels. Green points indicate the outliers from the best-fit relation (black solid line).
Current usage metrics show cumulative count of Article Views (full-text article views including HTML views, PDF and ePub downloads, according to the available data) and Abstracts Views on Vision4Press platform.
Data correspond to usage on the plateform after 2015. The current usage metrics is available 48-96 hours after online publication and is updated daily on week days.
Initial download of the metrics may take a while.