Fig. 1.
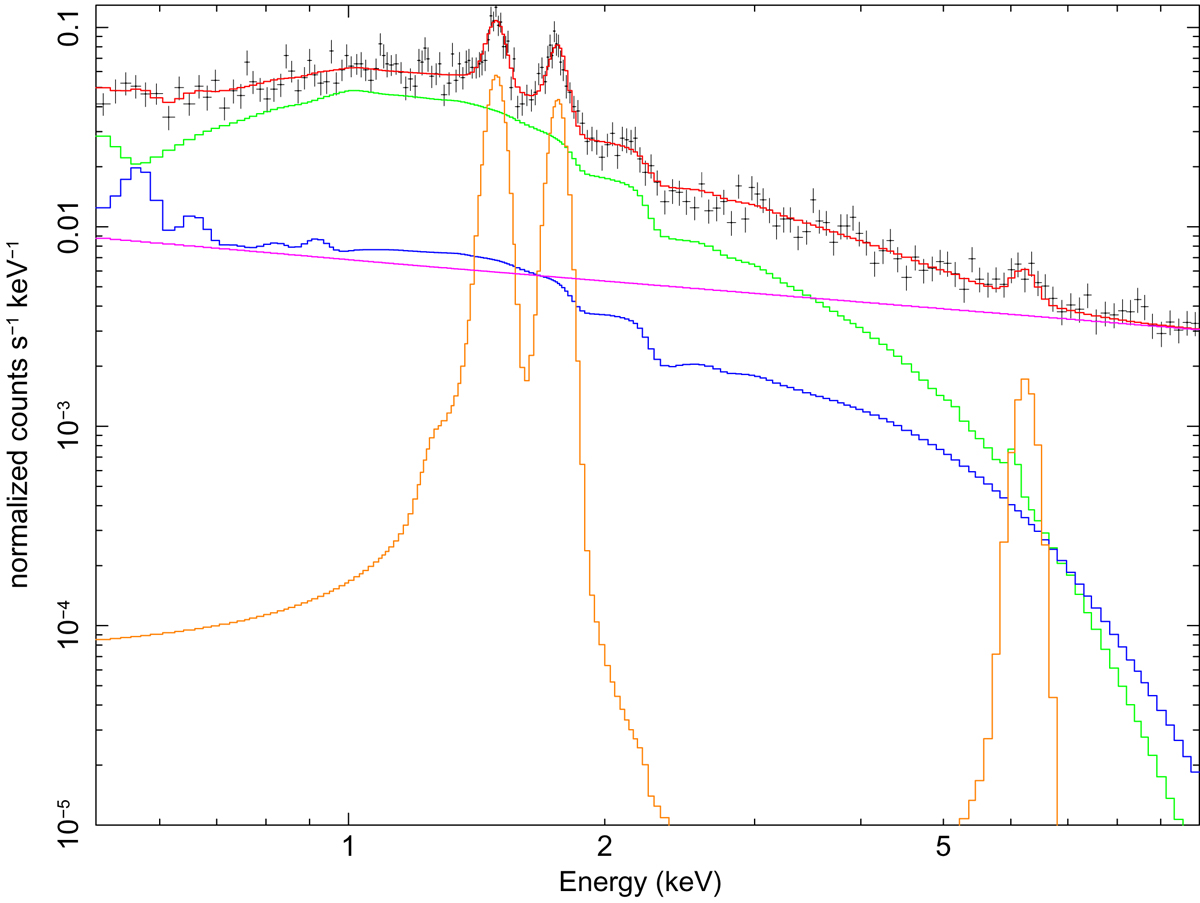
Spectrum extracted from a cluster annular region from an XMM-Newton observation (MOS1), with all the background components shown separately, derived as described in Sect. 3.1. Red: total resulting model; green: cluster thermal model; blue: X-ray sky background; orange: fluorescence instrumental lines; magenta: instrumental non X-ray background.
Current usage metrics show cumulative count of Article Views (full-text article views including HTML views, PDF and ePub downloads, according to the available data) and Abstracts Views on Vision4Press platform.
Data correspond to usage on the plateform after 2015. The current usage metrics is available 48-96 hours after online publication and is updated daily on week days.
Initial download of the metrics may take a while.