Open Access
Fig. 9.
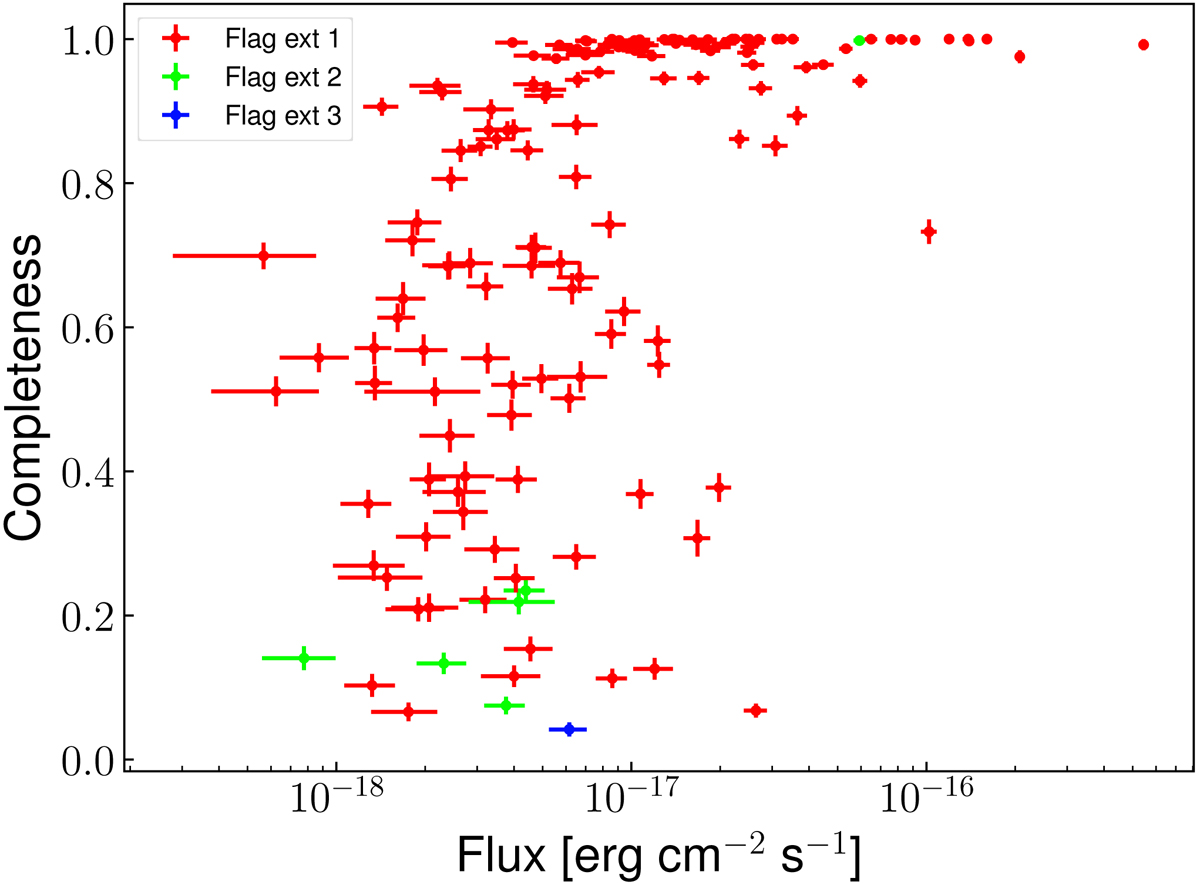
Completeness value for LAEs vs. their detection flux. Colours indicate the detection flags. We note that only the incompleteness owing to S/N on the unmasked regions of the detection layer is plotted in this graph (see Sect. 6.2).
Current usage metrics show cumulative count of Article Views (full-text article views including HTML views, PDF and ePub downloads, according to the available data) and Abstracts Views on Vision4Press platform.
Data correspond to usage on the plateform after 2015. The current usage metrics is available 48-96 hours after online publication and is updated daily on week days.
Initial download of the metrics may take a while.