Fig. 8.
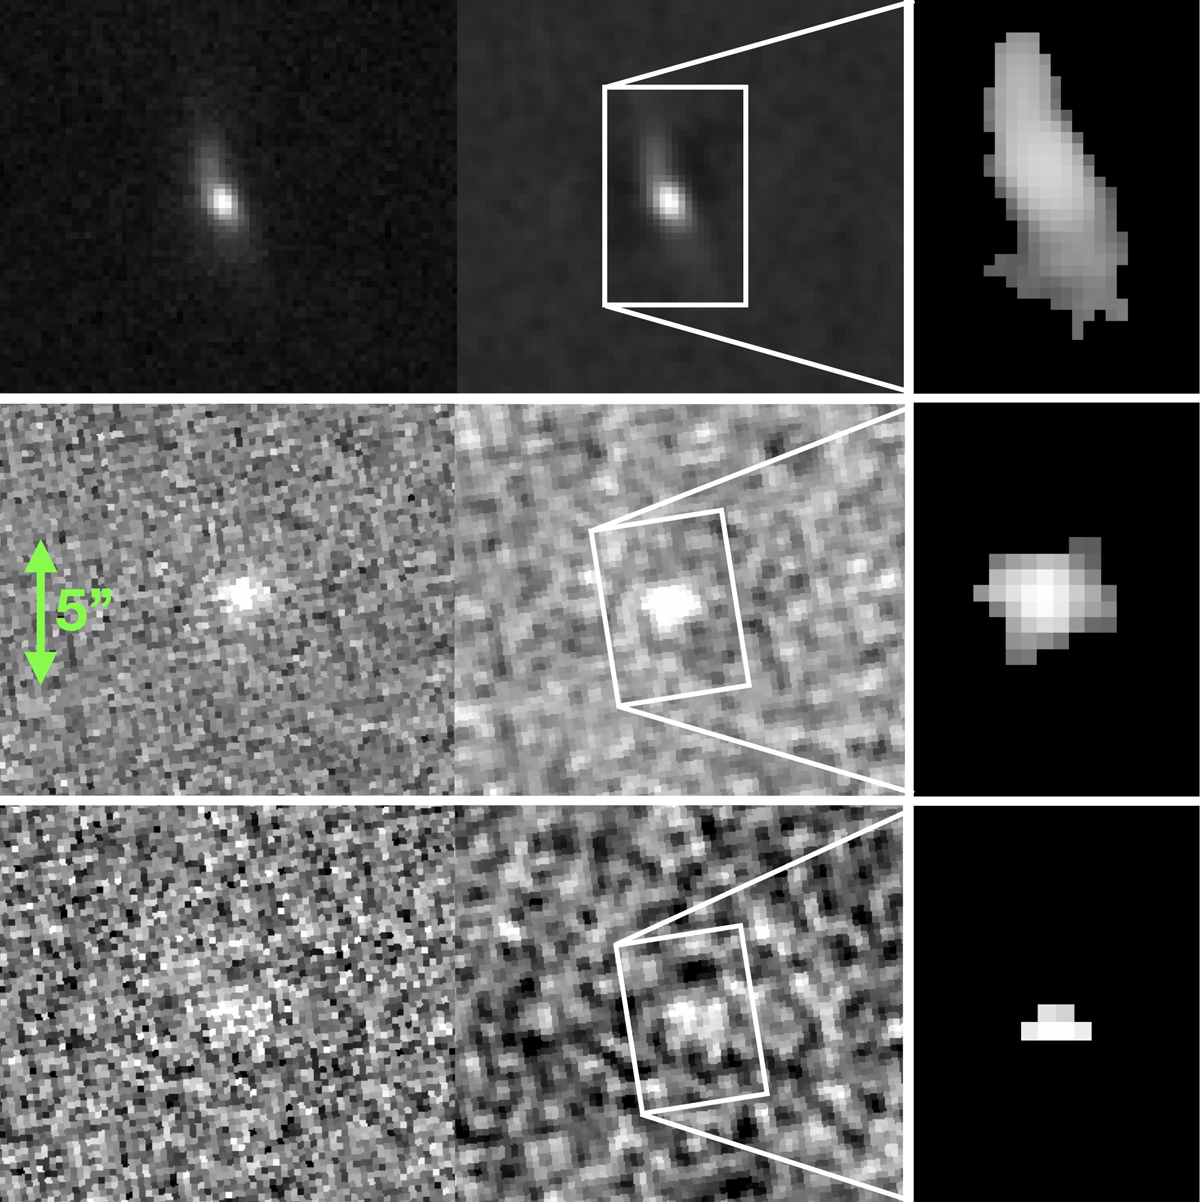
Example of source profile recovery for three representative LAEs. Left column: detection image of the source in the Muselet NB cube (i.e. the max-NB image). Middle column: filtered image (convolved and background-subtracted) produced by SExtractor from the image in the left column. Right column: recovered profile of the source obtained by applying the segmentation map on the filtered image. The spatial scale is not the same as for the two leftmost columns. All the sources presented in this figure have a flag value of 1.
Current usage metrics show cumulative count of Article Views (full-text article views including HTML views, PDF and ePub downloads, according to the available data) and Abstracts Views on Vision4Press platform.
Data correspond to usage on the plateform after 2015. The current usage metrics is available 48-96 hours after online publication and is updated daily on week days.
Initial download of the metrics may take a while.