Fig. 7.
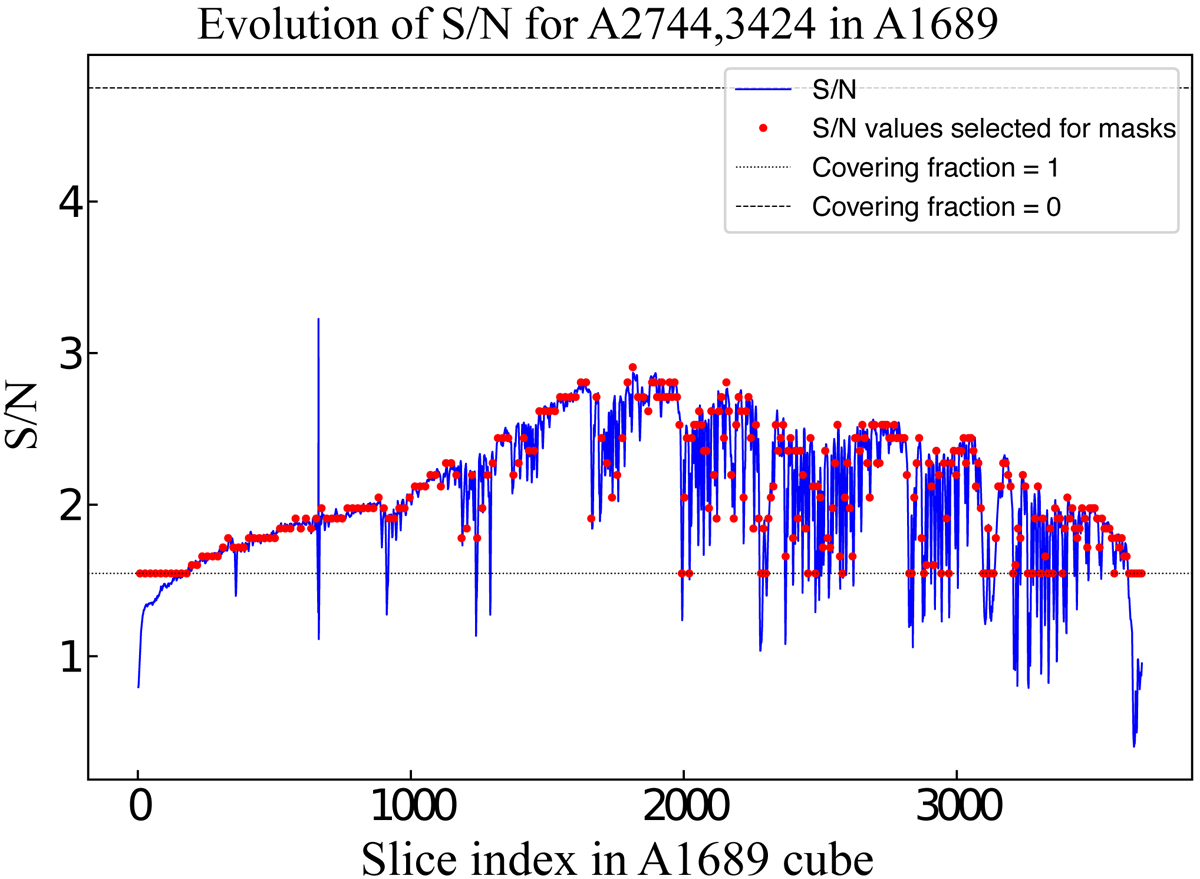
Example of the 3D masking process. The blue solid line represents the variations of the S/N across the wavelength dimension for the source A2744-3424 in the A1689 cube. The red points over-plotted represent the 2D resampling made on the S/N curve with ∼300 points. To each of these red points, a mask with the closest S/N value is associated. The short and long dashed black lines represent the S/N level for which a covering fraction of 1 (detected nowhere) and 0 (detected everywhere) are achieved, respectively. For all the points between these two lines, the associated masks have a covering fraction ranging from 1 to 0, meaning that the source is always detectable on some regions of the field.
Current usage metrics show cumulative count of Article Views (full-text article views including HTML views, PDF and ePub downloads, according to the available data) and Abstracts Views on Vision4Press platform.
Data correspond to usage on the plateform after 2015. The current usage metrics is available 48-96 hours after online publication and is updated daily on week days.
Initial download of the metrics may take a while.