Fig. 6.
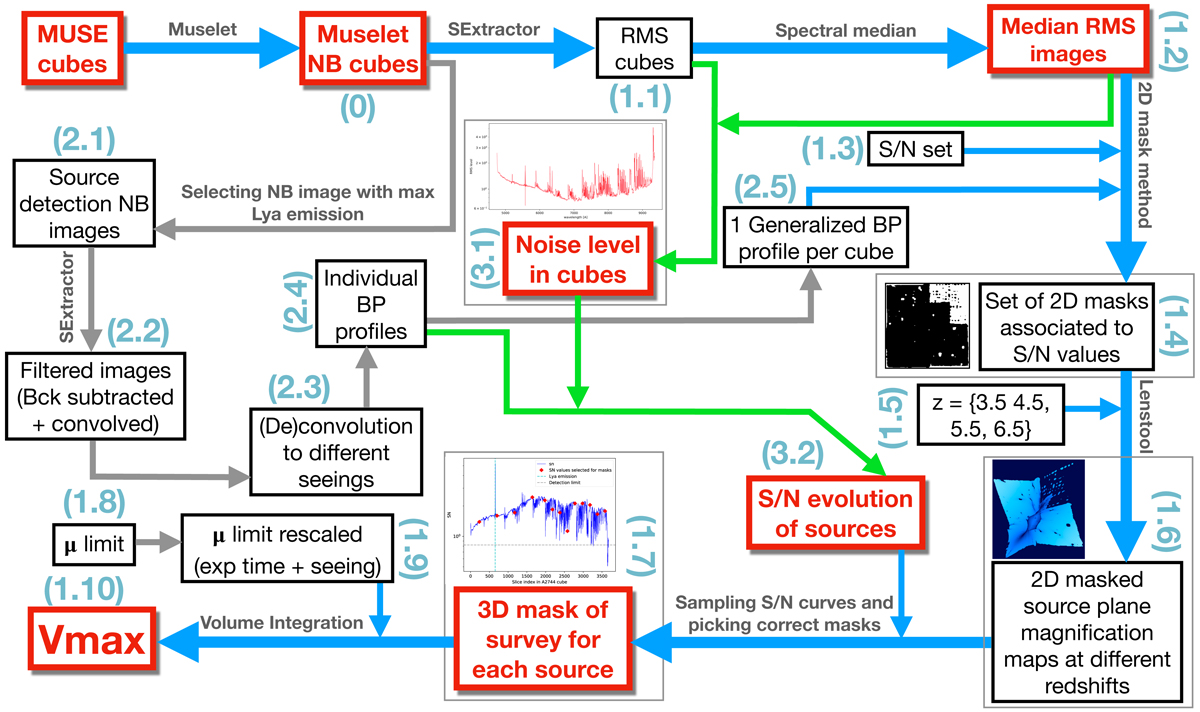
Flow chart of the method used to produce the 3D masks and to compute Vmax. The key points are shown in red and the main path followed by the method is indicated in blue. All the steps related to the determination of the bright pixels are shown in grey. The steps related to the computation of the S/N of each source are indicated in green. The numbered labels in light blue refer to the bullet points in Appendix D that briefly sum up all the differnt steps of this figure.
Current usage metrics show cumulative count of Article Views (full-text article views including HTML views, PDF and ePub downloads, according to the available data) and Abstracts Views on Vision4Press platform.
Data correspond to usage on the plateform after 2015. The current usage metrics is available 48-96 hours after online publication and is updated daily on week days.
Initial download of the metrics may take a while.