Fig. 3.
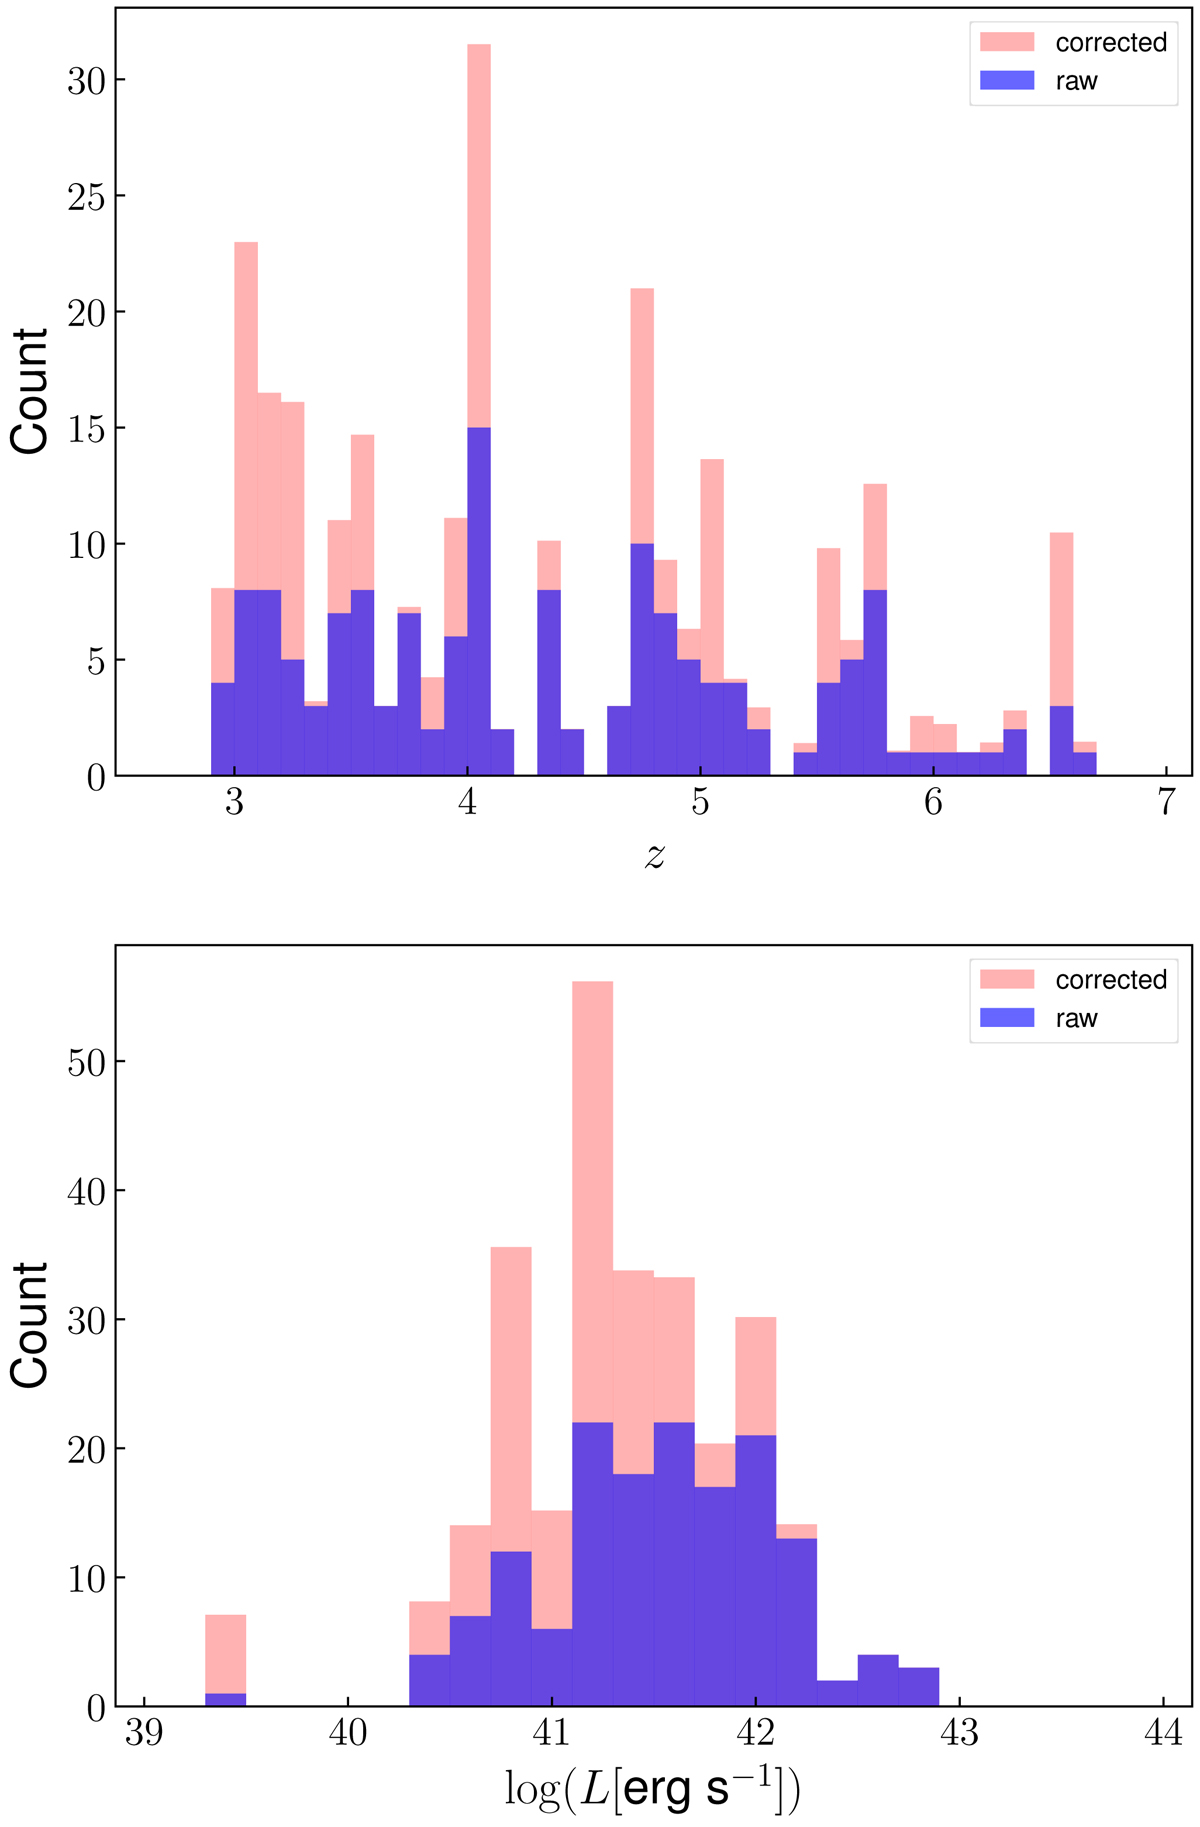
Redshift and magnification corrected luminosity distribution of the 152 LAEs used for the LF computation (in blue). The corrected histograms in light red correspond to the histogram of the population weighted by the inverse of the completeness of each source (see Sect. 6.2). The empty bins seen on the redshift histograms are not correlated with the presence of sky emission lines.
Current usage metrics show cumulative count of Article Views (full-text article views including HTML views, PDF and ePub downloads, according to the available data) and Abstracts Views on Vision4Press platform.
Data correspond to usage on the plateform after 2015. The current usage metrics is available 48-96 hours after online publication and is updated daily on week days.
Initial download of the metrics may take a while.