Fig. 2.
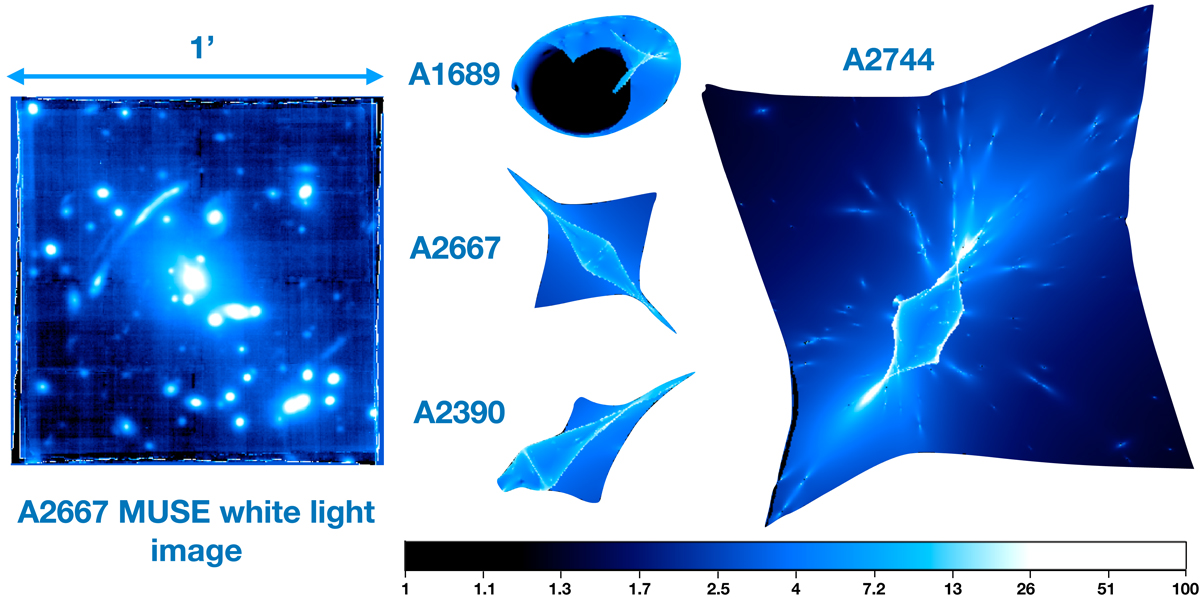
Left panel: MUSE white light image of the A2667 field represented with a logarithmic colour scale. Right panel: projection of the four MUSE FoVs in the source plane at z = 3.5, combined with the magnification map encoded in the colour. All images on this figure are at the same spatial scale. In the case of multiply imaged area, the source plane magnification values shown correspond to the magnification of the brightest image.
Current usage metrics show cumulative count of Article Views (full-text article views including HTML views, PDF and ePub downloads, according to the available data) and Abstracts Views on Vision4Press platform.
Data correspond to usage on the plateform after 2015. The current usage metrics is available 48-96 hours after online publication and is updated daily on week days.
Initial download of the metrics may take a while.