Fig. A.3.
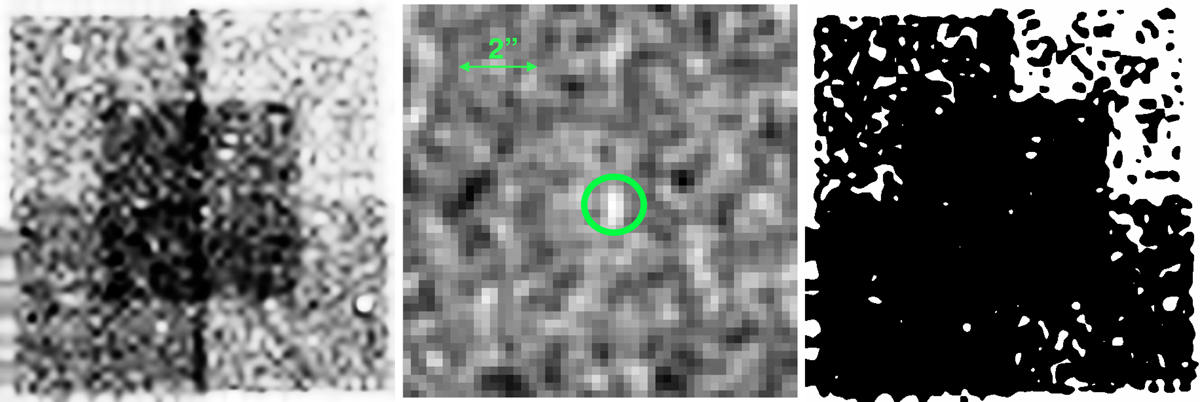
Left panel: example of RMS maps produced from one slice of the A2744 cube. The large-scale patterns are due to the different exposure times for the different parts of the mosaic. In the deepest part of this field, the noise is reduced because of a longer integration time. Middle panel: filtered image centred on one of the faint LAE in the A2744 field. The brightest pixels Bp were defined from this image. The size of the field is ∼10″. Right panel: mask produced by this method for the source shown in the middle panel, the masked pixels are shown in white. We can see on this image that the mask patterns closely follow the RMS map.
Current usage metrics show cumulative count of Article Views (full-text article views including HTML views, PDF and ePub downloads, according to the available data) and Abstracts Views on Vision4Press platform.
Data correspond to usage on the plateform after 2015. The current usage metrics is available 48-96 hours after online publication and is updated daily on week days.
Initial download of the metrics may take a while.