Fig. A.2.
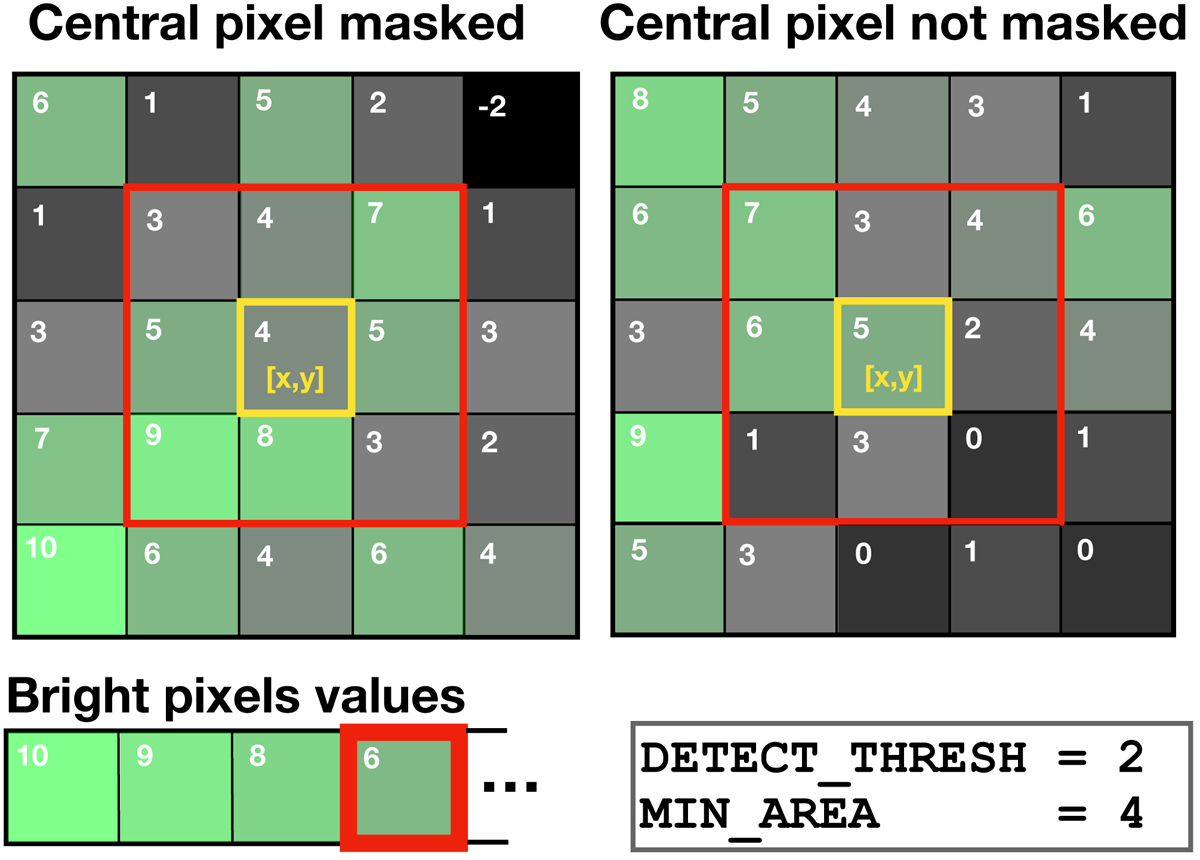
Illustration of the criterion used to create the mask. The grid represents part of an RMS map. To determine whether the central pixel [x,y] is masked or not, the bright pixels values shown on the bottom left are used; in this example, only the MIN_AREA-th pixel value =6 is used to compare with the local noise. Considering the central pixel [x, y], the comparison to the local noise is only done for the 9 pixels adjacent pixels (i.e. red square). The values used for the detection threshold and the minimal area in this example are 2 and 4, respectively. On the left, none of the pixels in the red area have values that are strictly less than min(Bp)/DETECT_THRESH = 3, which results in the central pixel being masked. On the right panel, three pixels fulfil the condition and the central pixel is not masked.
Current usage metrics show cumulative count of Article Views (full-text article views including HTML views, PDF and ePub downloads, according to the available data) and Abstracts Views on Vision4Press platform.
Data correspond to usage on the plateform after 2015. The current usage metrics is available 48-96 hours after online publication and is updated daily on week days.
Initial download of the metrics may take a while.