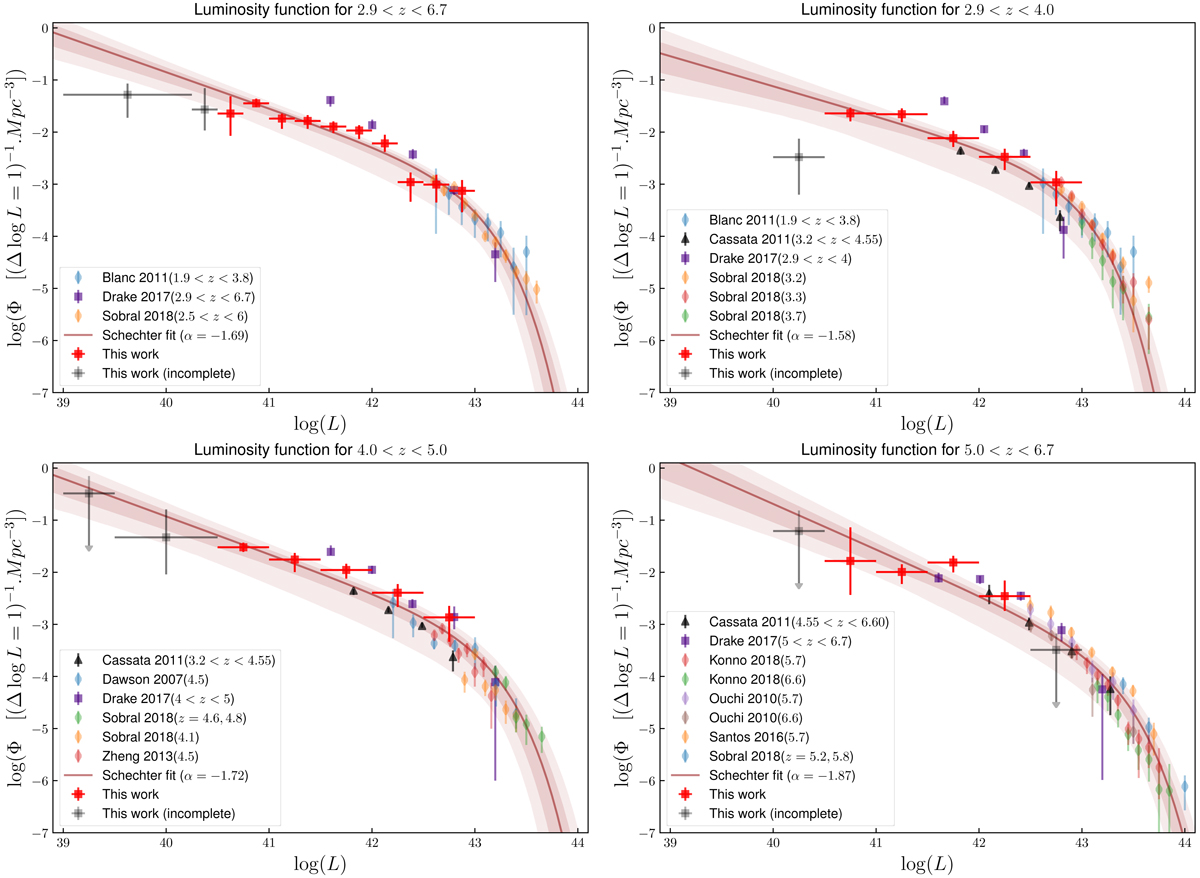
Fig. 13.

Luminosity functions and their respective fits for the 4 different redshift bins considered in this study. The red and grey squares represent the points derived in this work, where the grey squares are considered incomplete and are not used in the different fits. The literature points used to constrain the bright end of the LFs are shown as lightly coloured diamonds. The black points represent the results obtained by Cassata et al. (2011), which were not used for the fits. The purple squares represent the points derived using the Vmax method in D17 and are only shown for comparison. The best Schechter fits are shown as a solid line and the 68% and 95% confidence areas as dark red coloured regions, respectively.
Current usage metrics show cumulative count of Article Views (full-text article views including HTML views, PDF and ePub downloads, according to the available data) and Abstracts Views on Vision4Press platform.
Data correspond to usage on the plateform after 2015. The current usage metrics is available 48-96 hours after online publication and is updated daily on week days.
Initial download of the metrics may take a while.


