Fig. 12.
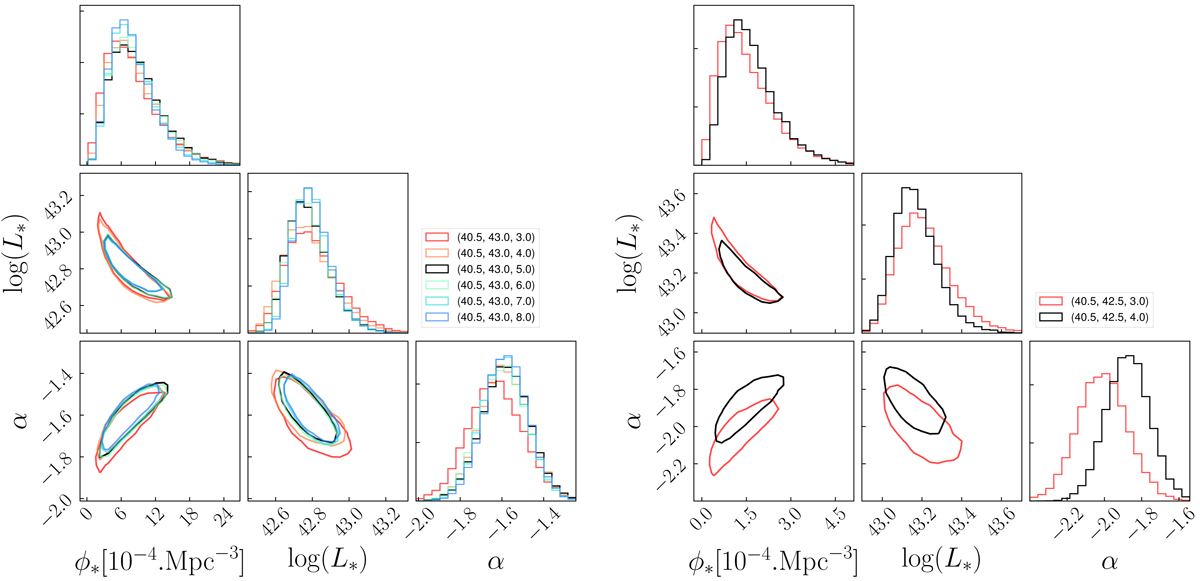
Areas of 68% confidence derived on the Schechter parameters when testing different binnings. Left panel: results for 2.9 < z < 4.0 and the right panel those for 5.0 < z < 6.7. The legends on the plots indicate, from left to right, log(L)min, log(L)max and the number of bins considered for the fit between these two limits. The black lines show the results obtained from the optimal bins adopted in this work.
Current usage metrics show cumulative count of Article Views (full-text article views including HTML views, PDF and ePub downloads, according to the available data) and Abstracts Views on Vision4Press platform.
Data correspond to usage on the plateform after 2015. The current usage metrics is available 48-96 hours after online publication and is updated daily on week days.
Initial download of the metrics may take a while.