Fig. 3
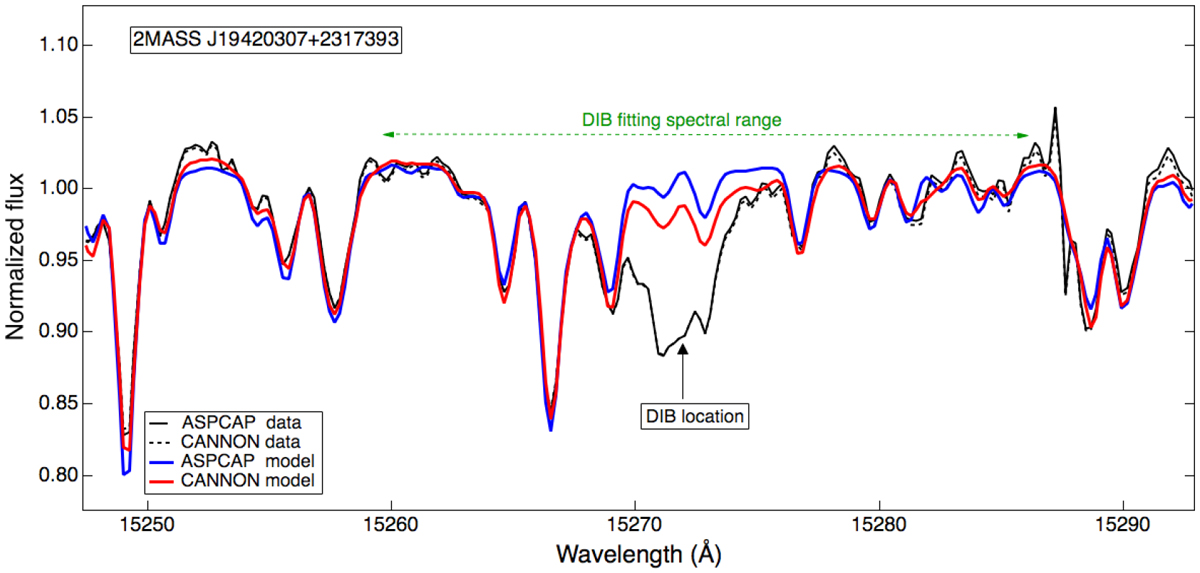
Spectrum of 2MASS J19420307+2317393 from ASPCAP (solid black) and Cannon (dashed line) data products. The associated synthetic stellar models are shown as dashed curves. We clearly see the difference between ASPCAP (blue) and Cannon (red) models around the 15 273 Å DIB location (black arrow). An offset was applied to ASPCAP data and model to facilitate the comparison.
Current usage metrics show cumulative count of Article Views (full-text article views including HTML views, PDF and ePub downloads, according to the available data) and Abstracts Views on Vision4Press platform.
Data correspond to usage on the plateform after 2015. The current usage metrics is available 48-96 hours after online publication and is updated daily on week days.
Initial download of the metrics may take a while.