Fig. 9.
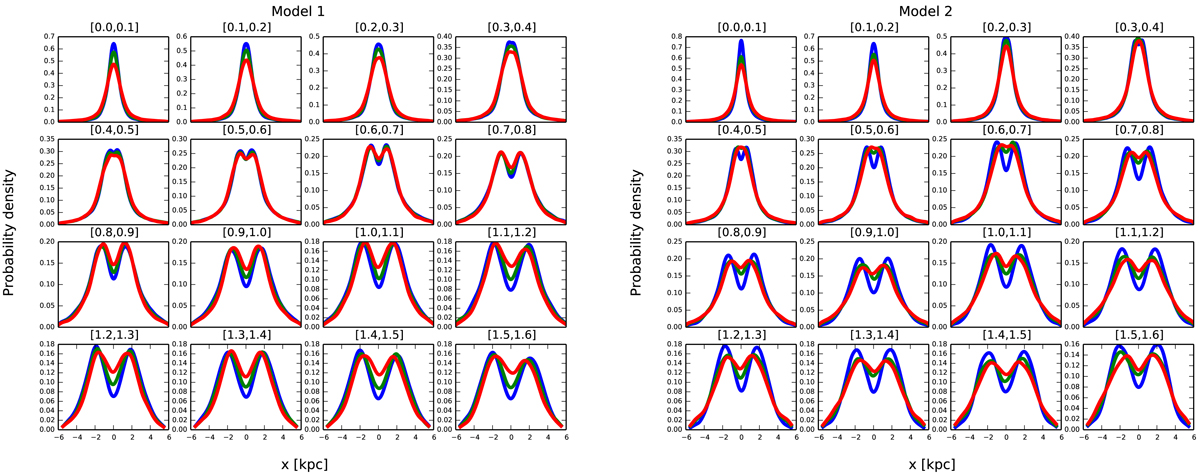
Distribution of stars along the bar major axis at different heights above the plane, as indicated at the top of each panel. The distributions of cold, intermediate, and hot stars in the B/P structure are indicated with blue, green, and red histograms, respectively. The distribution appears bimodal for all populations at the same height above the plane in Model 1 (left panel), while in Model 2 (right panel), the bimodality appears at larger heights for the hot population than for the colder ones.
Current usage metrics show cumulative count of Article Views (full-text article views including HTML views, PDF and ePub downloads, according to the available data) and Abstracts Views on Vision4Press platform.
Data correspond to usage on the plateform after 2015. The current usage metrics is available 48-96 hours after online publication and is updated daily on week days.
Initial download of the metrics may take a while.