Fig. 8.
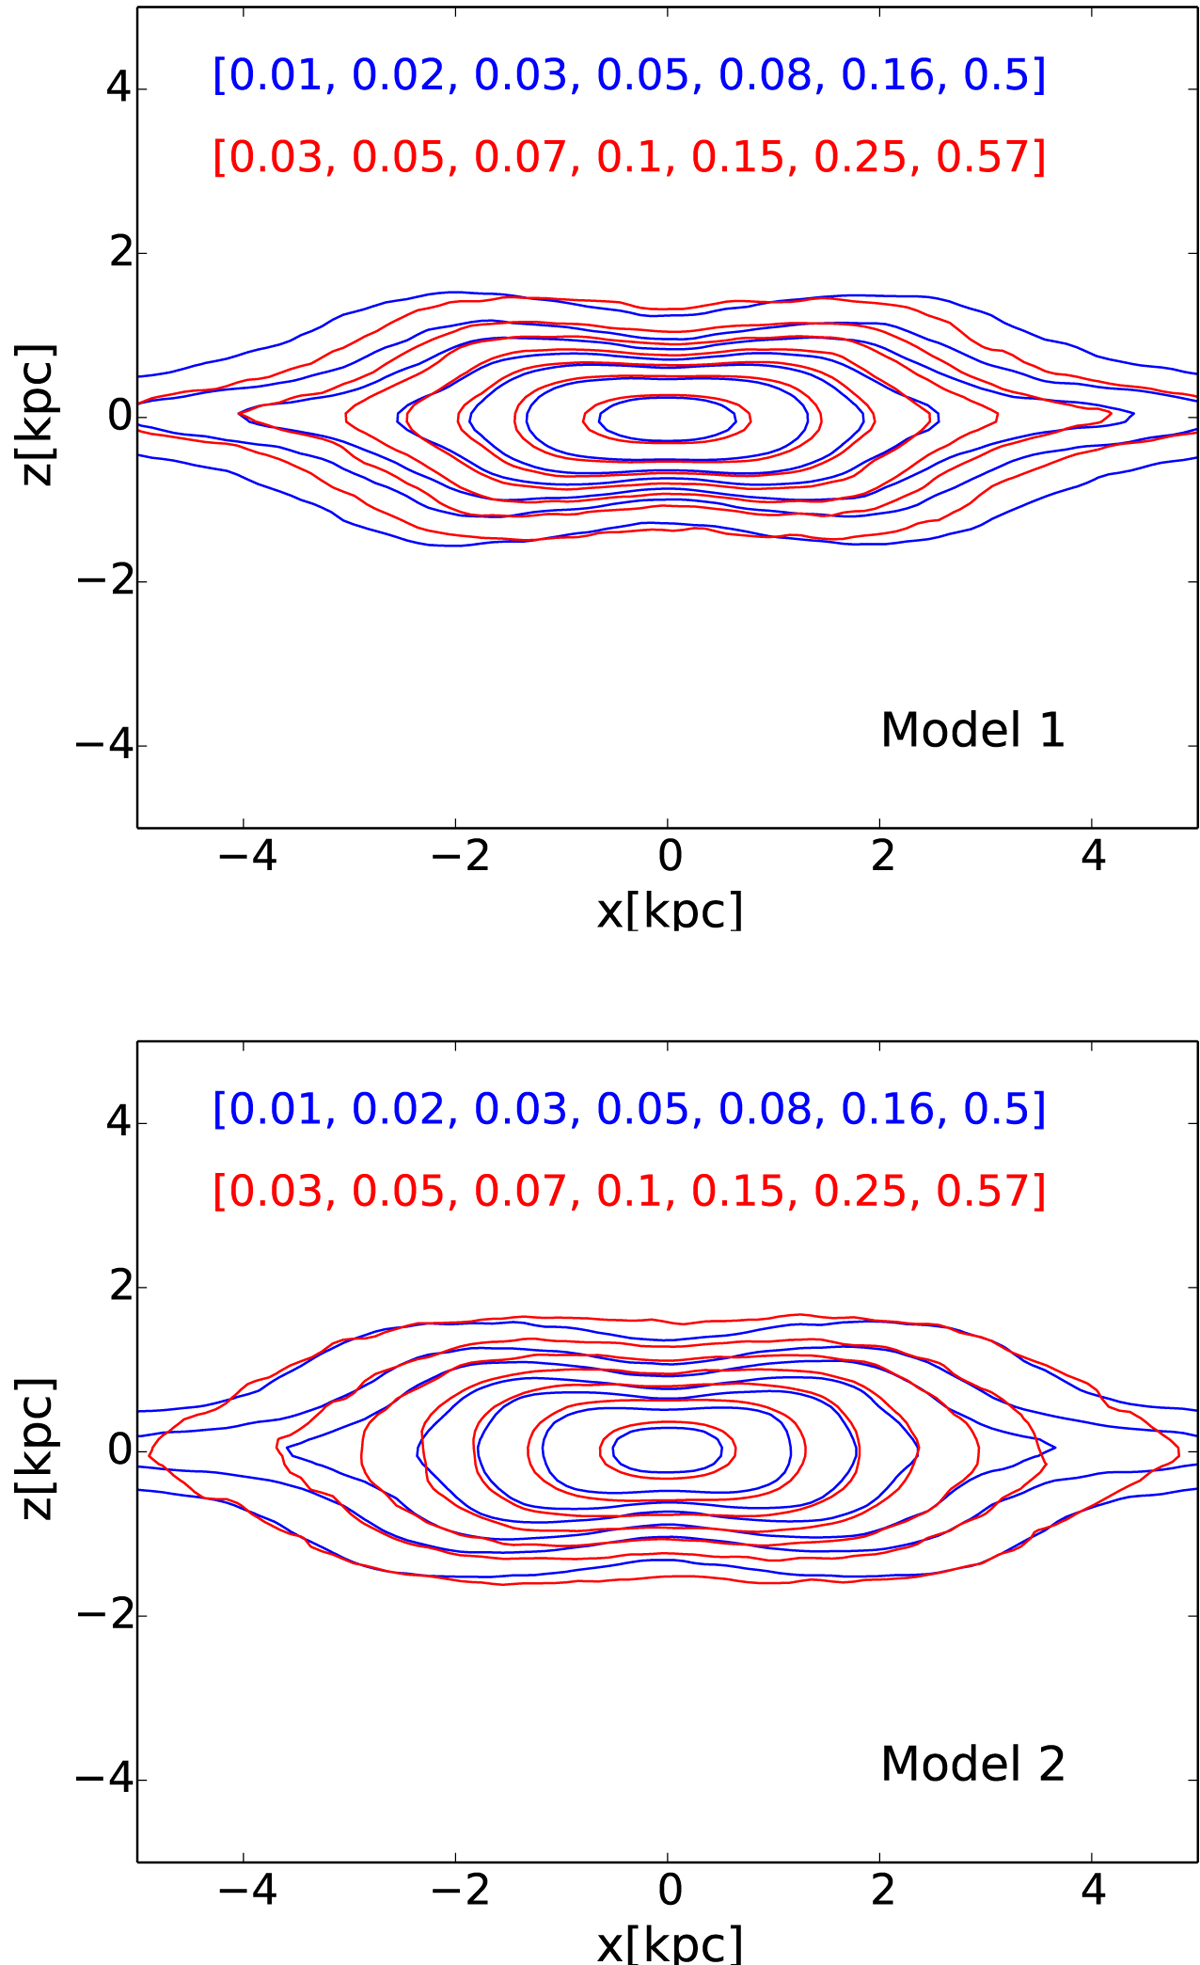
Isodensity contours of the B/P bulge in Model 1 (top panel) and Model 2 (bottom panel) for the initially kinematically cold (blue contours) and hot (red contours) disk populations at t = 5 Gyr. The contours of the intermediate disk are not shown, but they are bracketed by those of the cold and hot disk populations. The numbers at the top left of each panel indicate the values of the isodensity contours for cold and hot populations normalized to their central density. Only stellar particles in the bar region (|x| ≤ 5.5 kpc and |y| ≤ 3 kpc) have been selected for these plots.
Current usage metrics show cumulative count of Article Views (full-text article views including HTML views, PDF and ePub downloads, according to the available data) and Abstracts Views on Vision4Press platform.
Data correspond to usage on the plateform after 2015. The current usage metrics is available 48-96 hours after online publication and is updated daily on week days.
Initial download of the metrics may take a while.