Fig. 7.
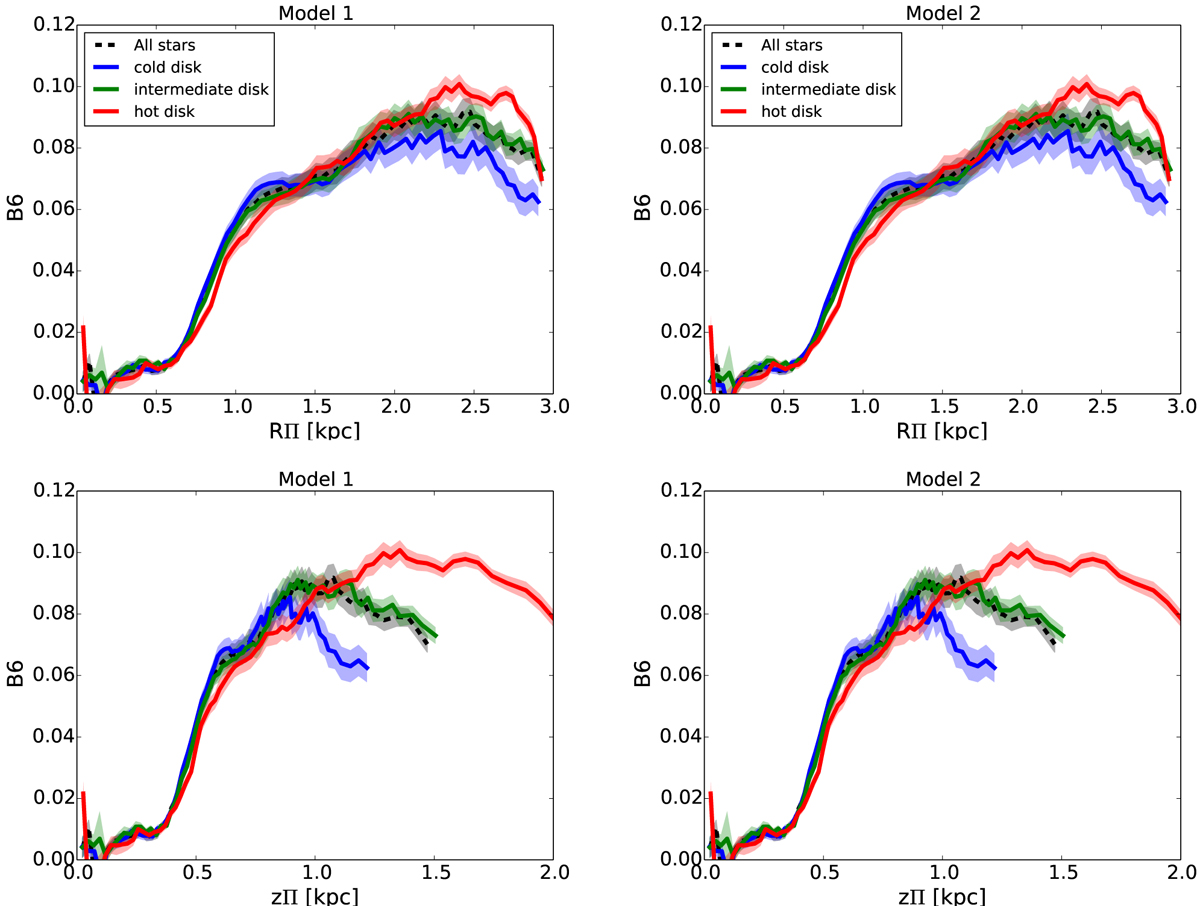
First row: B/P strength, quantified by means of the B6 parameter, as a function of the projected radial length of the peanut shape, RΠ, for Model 1 (left panel) and Model 2 (right panel). Second row: B/P strength as a function of the projected height of the peanut shape, zΠ, for Model 1 (left panel) and Model 2 (right panel). In all plots, the strength of the peanut shape is shown at t = 5 Gyr for all stars (black curves) and for stars initially belonging to the cold (blues curves), intermediate (green curves), and hot (red curves) disks. In all panels, error bars are represented by shaded areas and indicate the intensity rms scatter along each isophote after subtracting the best-fit pure ellipse with harmonic terms up to and including the sixth order.
Current usage metrics show cumulative count of Article Views (full-text article views including HTML views, PDF and ePub downloads, according to the available data) and Abstracts Views on Vision4Press platform.
Data correspond to usage on the plateform after 2015. The current usage metrics is available 48-96 hours after online publication and is updated daily on week days.
Initial download of the metrics may take a while.