Fig. 5.
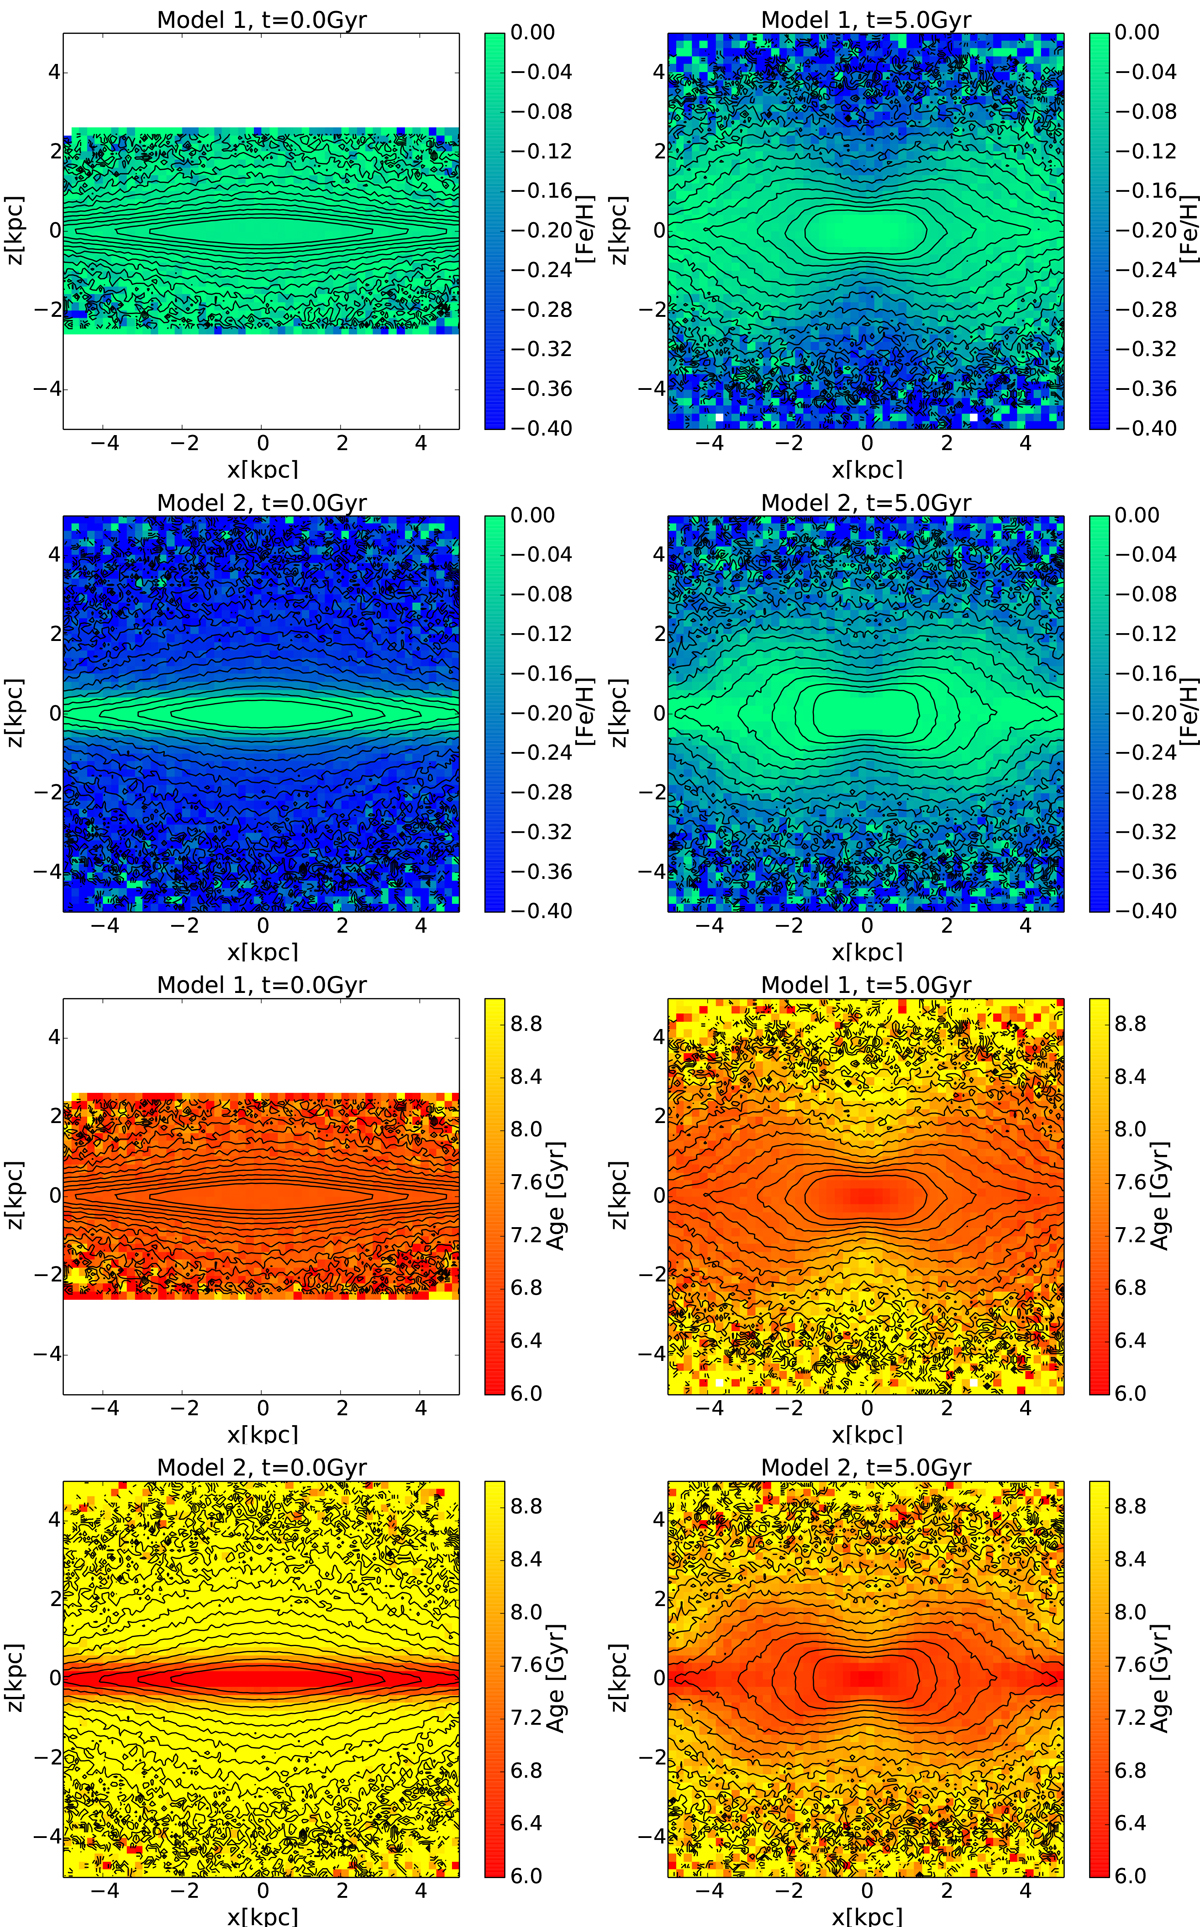
Edge-on metallicity and age maps for stars in Model 1 (first and third row) and for Model 2 (second and fourth row) at time t = 0 (first column) and at time t = 5 Gyr (second column). Only stars in the bar (|x| ≤ 5.5 kpc and |y| ≤ 3 kpc) have been selected. In all these maps, the bar when present is oriented side-on. Isodensity contours are shown in black.
Current usage metrics show cumulative count of Article Views (full-text article views including HTML views, PDF and ePub downloads, according to the available data) and Abstracts Views on Vision4Press platform.
Data correspond to usage on the plateform after 2015. The current usage metrics is available 48-96 hours after online publication and is updated daily on week days.
Initial download of the metrics may take a while.